
Application Case | Online Raman PAT for Rapid Detection of Camellia Oil Adulteration
2025-09-03
01 Application Background
Application Focus: Detection of Adulteration in Camellia Oil
Traditional methods for detecting adulteration in edible oils primarily rely on physicochemical assays, chromatography, GC-MS, infrared spectroscopy, and other techniques. These methods often require cumbersome pre-treatment processes, are time-consuming, labor-intensive, costly, and unable to trace the origin of the oil. This leads to inefficiencies and delays in data acquisition for researchers in both experimental and applier settings.
02 Case Study
In an edible oil R&D project at a Provincial Academy of Forestry, camellia oil is widely promoted due to its unique nutritional value and health benefits. However, incidents of adulteration and counterfeiting in the market not only compromise the quality and brand reputation of camellia oil but also interfere with experimental results. Therefore, the R&D team required an efficient and reliable detection method for measuring adulteration during camellia oil development and quality control.
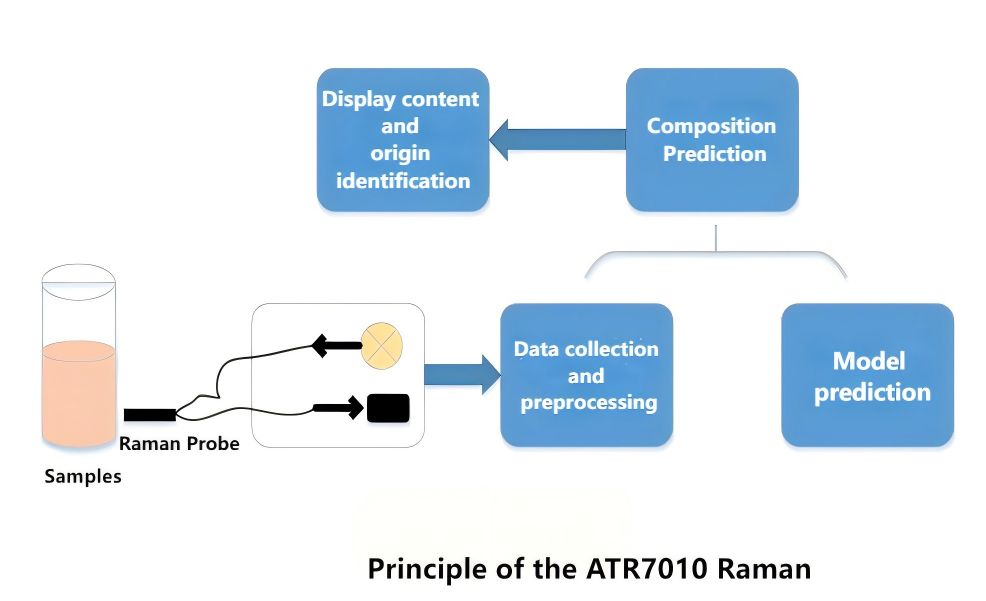
To address these challenges, the customer chose the ATR7010 Online Raman PAT of Optosky. This instrument utilizes Raman spectroscopy for non-destructive testing of edible oils. Through proprietary algorithms for modeling and analysis, it achieves accurate detection of adulteration in high-value oils like camellia oil. The absolute measurement error is controlled within 2%, and the results have been highly commended by users.
On-Site Experiment
Software Analysis
The ATR7010 Raman spectrometer was used to test camellia oil, soybean oil, and camellia oils from different regions. The resulting spectral information is shown in the figures below:
Raman characteristic spectra of edible oils
Raman characteristic spectra of camellia oils from different origins
As shown above: camellia oil and soybean oil exhibit characteristic Raman peaks at wavenumbers 1262 cm⁻¹, 1298 cm⁻¹, 1437 cm⁻¹, and 1653 cm⁻¹. The peaks at 1263 cm⁻¹ and 1653 cm⁻¹ are characteristic of unsaturated fatty acids, while those at 1298 cm⁻¹ and 1437 cm⁻¹ are characteristic of saturated fatty acids. Different adulteration ratios result in variations in the intensity of these characteristic peaks.
Furthermore, camellia oils from different origins also show differences in Raman peak intensities, enabling users and relevant institutions to identify the geographic origin of the edible oil. By analyzing the Raman spectral intensities of characteristic peaks from different camellia oils at various concentrations, origin prediction and adulteration concentration analysis can be performed. The analysis results are as follows:
Origin identification using Raman quantification software
Relationship between adulteration concentration and Raman characteristic peak intensity in camellia oil
ATR7010 can distinguish and identify the origin of camellia oil. Raman spectral analysis of the characteristic peaks of edible oils shows a strong linear relationship between spectral intensity and the level of adulteration.
Single-feature linear models can exhibit significant random deviations in analysis, potentially leading to inaccuracies. Using 20 training samples of camellia-soybean oil mixtures with 5% concentration intervals, multiple linear regression was performed based on the characteristic peak intensities of camellia oil. The cross-validated R² value reached 0.99. Utilizing multiple features significantly enhances model robustness compared to using a single feature. The established model is shown below:
Soybean oil was adulterated into camellia oil at concentrations of 9.99%, 19.47%, 30.03%, 39.39%, 50.01%, 59.93%, 69.98%, 79.75%, and 88.68%. Raman intensities of these samples were measured using the Raman spectrometer and validated against the model established by our instrument.
A comparison between the model predictions and actual results is shown below:
Multiple linear regression model
03 Product Introduction
ATR7010 Online Raman PAT
Pharmaceutical Efficacy Testing
Benzoic acid testing in white oil
Benzoic acid testing in white oil
Biochemical indicator detection
Product Features
-
Quantitative Detection: Eliminates complex sampling, avoids operator exposure to hazardous chemicals—safe and efficient.
-
Real-Time Monitoring: Supports reaction endpoint alarms, saves production time, and reduces losses from anomalies.
-
High Sensitivity: Cooled CCD enables low-concentration detection, down to 0.1%.
-
Strong Applicability: High-temperature resistant, acid-alkali resistant long probe meets demands of complex environments.
-
One-Click Analysis: User-friendly software interface and one-click operation design for ease of use and fast results.
Application Fields:
Crystallization processes, biocatalysis and enzymatic catalysis, flow chemistry, polymorph identification, bioprocess monitoring, chemical synthesis, and more.
ATR7010 Online Raman PAT, independently developed by Optosky, leverages its high sensitivity and real-time monitoring capabilities. It has not been successfully applied to the detection of adulteration in camellia oil within edible oil R&D but also demonstrates excellent performance in applications such as pharmaceutical efficacy testing, benzoic acid detection in white oil, and biochemical indicator analysis. Its rapid and accurate detection capabilities effectively meet diverse client needs in quality control and R&D.
Raman Advantage — Technical Analysis Comparison
ATR3110 Raman Spectrometer Accepted for Mineral Pigment ID
Related Article

Discover the Optosky ATR1600 ultra-micro Raman spectrometer—a 210g pocket-sized device for on-site, non-destructive gemstone identification. With a 20,000+ substance spectral library, dedicated jewelry edition, Bluetooth smartphone APP, and PDF reporting, it enables rapid screening of natural, synthetic, and treated gemstones at exhibitions, pawnshops, and markets.
ATR1600: The 210g Pocket Raman Gem Identifier
Explore how micro-confocal Raman spectroscopy, combined with SERS, enables rapid, non-destructive, molecular-level screening of veterinary drug residues such as malachite green, enrofloxacin, and chloramphenicol in aquatic products. Learn how Optosky’s ATR8100 supports microscopic localization, multi-wavelength excitation, mapping imaging, and portable on-site testing—while clarifying its role alongside LC-MS/MS confirmation.
Applications | Micro-Raman Drug Residue Screening in Seafood
Discover how Raman spectroscopy enables label‑free cancer diagnosis by reading molecular fingerprints of cells. From key Raman peaks and AI‑powered classification to the ATR8800 confocal platform, this article explores the frontiers, challenges, and clinical potential of Raman‑based cancer detection.
How Raman Spectroscopy Sees Through Cancer Cells: Label‑Free Cancer Diagnosis
Optosky successfully delivered and commissioned multiple ATP9100 field spectroradiometers at a university in Northwest China. The project included installation, performance verification, and on‑site training – supporting agricultural remote sensing, ecological monitoring, and geological surveys while building a standardized spectral research platform.
Case Study | ATP9100 Acceptance at Northwest University