
Application : Rapid Detection of Sevoflurane with Handheld Raman Analyzer
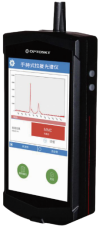
Product:ATR6500
01. Experimental Background
Sevoflurane, is a derivative of fluorinated methyl isopropyl ether with the chemical formula C4H3F7O. It is a non-flammable liquid at room temperature with a boiling point of 58°C. Sevoflurane was synthesized in 1968, and in 1984, Japan purchased its patent rights and approved its clinical use in 1990. Sevoflurane is a medical inhalation anesthetic with advantages such as rapid anesthesia induction, adjustable anesthesia depth, and minimal respiratory tract irritation. It is widely used in surgical operations and pediatric outpatient surgeries.
The Detection method of Raman spectroscopy has the advantages of being non-destructive and rapid, and it has developed rapidly in recent years. Especially with handheld Raman spectrometers, which are small, highly sensitive, and convenient for on-site use, suspected substances can be quickly and accurately tested.
02. Experimental Design
Instruments:
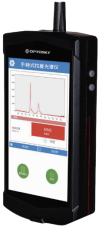
Optosky Handheld Raman Analyzer (ATR6500); Laser wavelength 785 ± 0.5 nm; Resolution: 7-10 cm⁻¹; Wavenumber range: 200-4000 cm⁻¹
Reagents and Materials
- Sevoflurane reference substance
- Quartz glass sample vial (1.5 mL)
- Glass sample vial (1.5 mL)
- Brown reagent bottle (500 mL)
- 15 mL polypropylene plastic centrifuge tube
- Quartz sample cell
Analytical Conditions
Handheld Raman Analyzer Testing Conditions
- Laser wavelength: 785 nm
- Laser power: 300 mW
- Scanning range: 200-4000 cm⁻¹
- Integration time: 1 ms
Results and Discussion
Raman spectra for different material containers.
The Handheld Raman Analyzer can perform non-destructive testing on samples.
For liquid samples, direct irradiation and testing through glass bottles or other translucent containers is generally possible.
The different materials of the container have different disturbances and effects on the subsequent test.
The Raman spectra of common container materials are shown in Image 1 to 5.
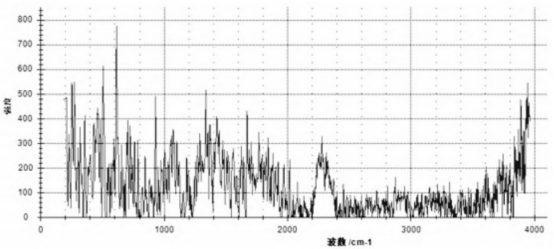
Image 1: Quartz glass sample vial (1.5 mL)
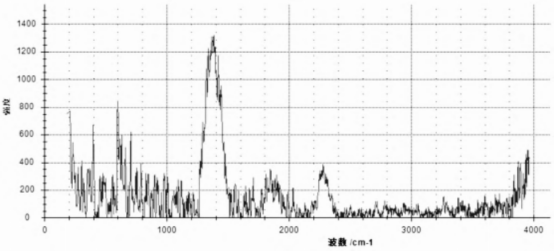
Image 2: Glass sample vial (1.5 mL)
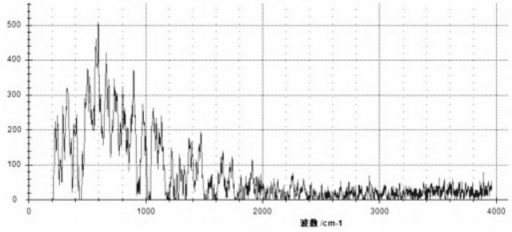
Image 3: Brown reagent bottle (500 mL)
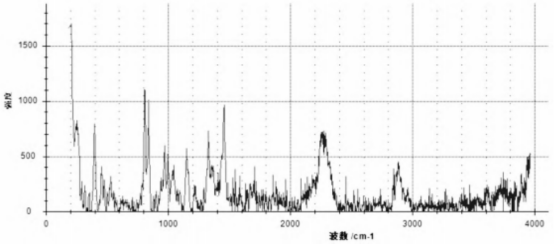
Image 4: 15 mL polypropylene plastic centrifuge tube
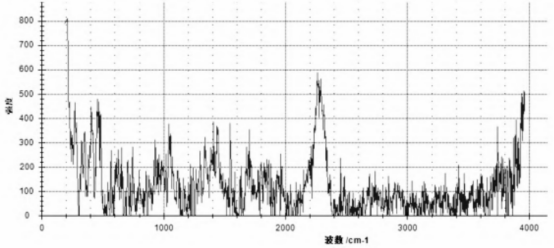
Image 5: Quartz sample cell
From images 1 to 5, the containers of different materials have different effects on the detection.
In practical tests, it is important to choose containers with minimal interference.
Compare images, it was concluded that the use of a quartz glass sample vial or a quartz sample cell caused the least spectral interference and therefore the best detection.
Containers made of material with significant interference require interference from the container itself to be subtracted to obtain the Raman spectrum of the target material.
The Effect of Container Wall Thickness
The Raman signal varies with the wall thickness of the same type of container.
Image 6 shows the signal of sevoflurane liquid in a glass sample vial, with different numbers of glass slides placed between the probe and the sample vial to simulate different thicknesses.
From the image, it is evident that as the thickness increases, the Raman signal intensity decreases sequentially, and the Raman signal intensity of the glass components becomes the strongest.
Therefore, in actual measurements, if the packaging is too thick, the liquid sample needs to be transferred to a transparent sample vial or sample cell with thinner walls for better Raman signal detection.
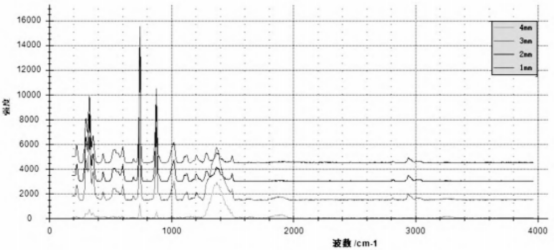
Image 6: Raman Spectra of Sample Vials with different wall thicknesses
The Effect of Different Focal Distances
The typical focal length of a hand-held Raman analyzer is 3 to 5 mm, so it is common to cling to the container package for measurements.
The following image shows the Raman spectra of sevoflurane at different distances between the probe and the sample cell.
As shown in Image 7, good Raman signals are obtained when the probe is 1 mm and 2 mm away from the sample vial.
Above 2 mm, the interference signal increases significantly, the signal strength of sevoflurane decreases, and part of the Raman shift is lost.
Therefore, during the actual measurement, the distance between the probe and the sample should be kept within the focal length of the device to achieve the optimal signal.
Image 7: Raman Spectra of Sevoflurane at Different Distances Between the Probe and the Sample Vial
The Effect of Different Laser Powers
The laser power of a handheld Raman analyzer is generally linearly adjustable.
As the power increases, the signal intensities of both the target and the interfering material increase.
When the enhancement of the target substance is greater than that of the interfering substances, or when the interference can be eliminated through spectral subtraction, higher power settings can be used for analyze.
Power selection also needs to be considered based on the nature of the target substance. For example, if the sample is a dark colored substance or a flammable and explosive material, the power should be set to avoid scorching or damaging the sample.
Image 8 shows the Raman spectra of sevoflurane at different powers, with the most complete Raman peaks and strongest signal at 300 mW.
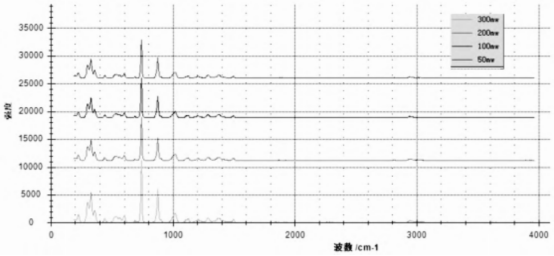
Image 8: Raman Spectra of Sevoflurane at Different Laser Powers
Standard Raman Spectra of Sevoflurane
We detected the quartz sample cell and obtained its spectrogram.
The sevoflurane standard was tested in a quartz sample cell and its spectrogram was obtained: Fig. 9.
By subtracting the spectrum of the quartz sample cell from the spectrum in Image 9, we obtain the Raman spectrum of the sevoflurane standard: Image 10.
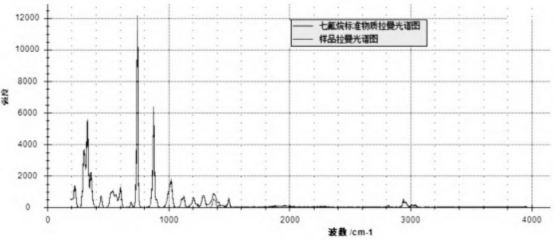
Image 9: Raman Spectrum of Sevoflurane in Quartz Sample Cell
Image 10: Raman Spectrum of Sevoflurane Standard
03. Application
Customs conducted tests on a brown bottle suspected of containing the liquid sevoflurane
Using the method described above, the suspect sample was placed in a quartz sample cell and tested, with spectral subtraction performed to obtain the Raman spectrum of the suspect sample.
The Raman spectrum of the suspicious sample was compared with that of the sevoflurane standard, as shown in Image 11, and the spectra matched perfectly.
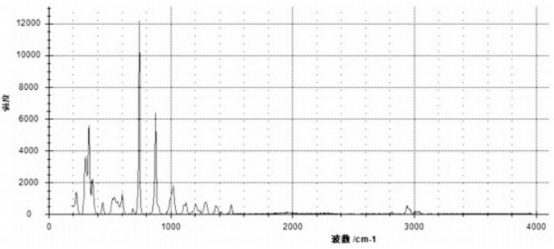
Image 11: Comparison of spectra between Sample and Sevoflurane
We can also compare the Raman spectrum of the suspect sample to the standard sevoflurane in the database (the standard sevoflurane spectrum is added to the database in advance), and the similarity match is more than 95%.
04. Conclusion
Sevoflurane samples can be probed by a hand-held Raman spectrometer with a laser wavelength of 785 nm, and spectroscopic comparisons between the samples and standard products can be performed for the purpose of rapid detection. The method is reliable and accurate.
RECOMMENDATION:ATR6500
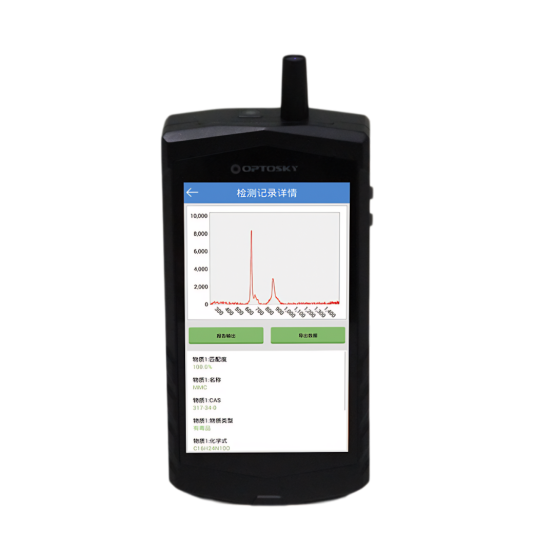
Appearance Design
- Weight is only 450 g Highly portable.
Advantages
- Advanced Raman recognition algorithms
- A library of up to 20,000 spectrogram is max.
- Allows user-added spectral data.
- Android, 5.5-inch HD screen, Dual HD cameras (13 MP + 8 MP)
- Wi-Fi, Bluetooth, GPS.
Application
- Drug and hazardous material detection
- Pharmaceutical raw material and auxiliary material identification, Food Safety
- Industrial substance identification and process control
- Identification Gem and Cultural Relics, Screening of ore
Raman Application in Diesel Detection
Product Recommendation|Application Case Study of ATR3000-Mobile Raman Spectrometer
Related Article
