
Technical Report—Raman Spectroscopy Detection of SERS Substrate Samples
Overview
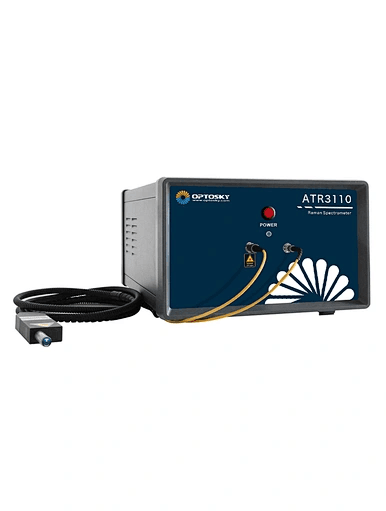
According to customer needs, in order to test the effect of Raman spectrum on the detection of SERS substrate samples, Optosky used two instruments ATR3110-532/785 to detect the SERS substrate sample in Figure 1. The wave number range of ATR3110-532 is 200-3700cm-1 , the wave number range of ATR3110-785 is 200-2700cm-1. Drop the melamine solvent onto the SERS substrate and other carriers for testing respectively, and record the testing process as a video and return the sample spectrum.
Figure 1 SERS Substrate Sample
Test method
Connect the ATR3110-532 and ATR3110-785 instruments to the computer respectively, install the probe on the holder, align the sample test position, find the best test distance by adjusting the height of the probe, and finally adjust the integration time and laser power for testing.
Test Results
The specific collection results are as follows:
Control group: melamine solvent + SERS reagent
ATR3110-532
Before baseline correction:
After baseline correction:
ATR3110-785
Before baseline correction:
After baseline correction:
Conclusion
According to the above test results:
Using the ATR3110-785/532nm Raman spectrometer, it can be seen that using the SERS substrate as the sample carrier can effectively improve the signal-to-noise ratio of the Raman signal, thereby detecting the Raman characteristic peaks of the substance to be detected. And the longer the excitation wavelength, the better the effect.
Raman Spectrometer In Food Safety (Additive Detection)
Solution Recommendation | Micro-Raman Spectrometer Assists the Research of Lithium-ion Batteries
Related Article
