Spectrometer In Agriculture:Non Destructive Detect For Fruit Maturity And Brix
2024-06-28
Background
Fruit maturity is a key quality indicator in agricultural production, which is of great significance in determining the fruit picking period and judging the freshness of the fruit. In traditional agriculture, vision is mainly relied on to judge the color of fruits to distinguish different maturity levels. This method is greatly affected by human factors such as experience, and is not suitable for some fruits whose skin color cannot accurately reflect the maturity change. NIR Analyzer was used to analyze the content and spectral changes of the total sugar, total acid, carotene and other physical and chemical components of fruits under different maturity levels. By preprocessing spectral data and combining it with PLS modeling, rapid non-destructive and non-contact detection of fruit maturity or other quality parameters is finally achieved.
Rapid Detection Of Tomato Brix Based On Near-Infrared Absorption Spectroscopy
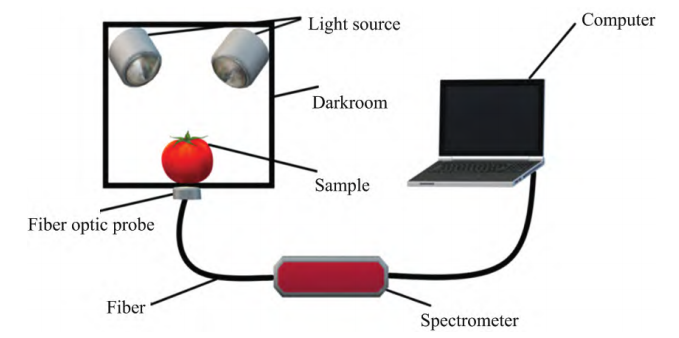
China Agricultural University uses a miniature near-infrared spectrometer (wavelength range: 900-1700nm), tungsten halogen light source, optical fiber, optical fiber probe and computer to build the experimental platform shown in Figure 1. China Agricultural University selected a total of 255 samples of tomatoes with different maturity levels and uniform, smooth and undamaged surfaces. They placed the samples close to the front end of the optical fiber probe of the miniature near-infrared spectrometer for scanning. Take 3 absorbance spectral data for each sample, and take the average value as the spectral data of the sample. The experiment was re-calibrated for the whiteboard every 5 tomatoes tested.
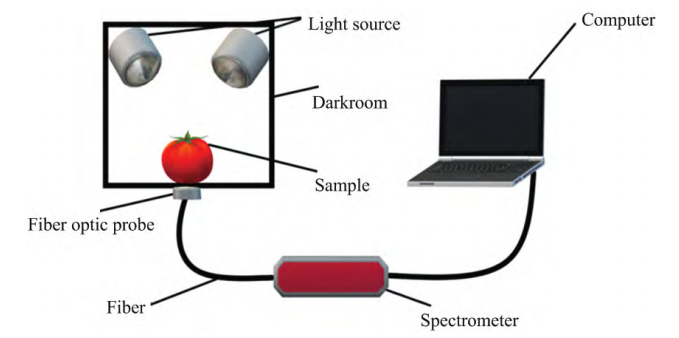
Figure 1 Spectral Data Collection Experimental Platform
China Agricultural University finally obtained the absorbance spectra of all samples, as shown in Figure 2. Since the spectral edge data (900~930 and 1650~1700nm) are noisy, the signal-to-noise ratio is low. They selected spectral data from 930-1650nm for data preprocessing and modeling analysis. China Agricultural University data preprocessing uses four preprocessing methods: standard normal variation (SNV), multivariate scattering correction (MSC), normalization (NOR) and convolution smoothing (SG) to preprocess the spectral data. The post-spectral data plot is shown in Figure 3. In the modeling analysis, China Agricultural University used the adaptive reweighting algorithm (CARS) to select the variables corresponding to the model with the smallest cross-validation root mean square error based on the adaptive weighting algorithm. The algorithm finally screened out 54 characteristic wavelengths, and combined with PLS modeling, the relative coefficient reached 0.91 and the standard deviation was 0.14°Brix.
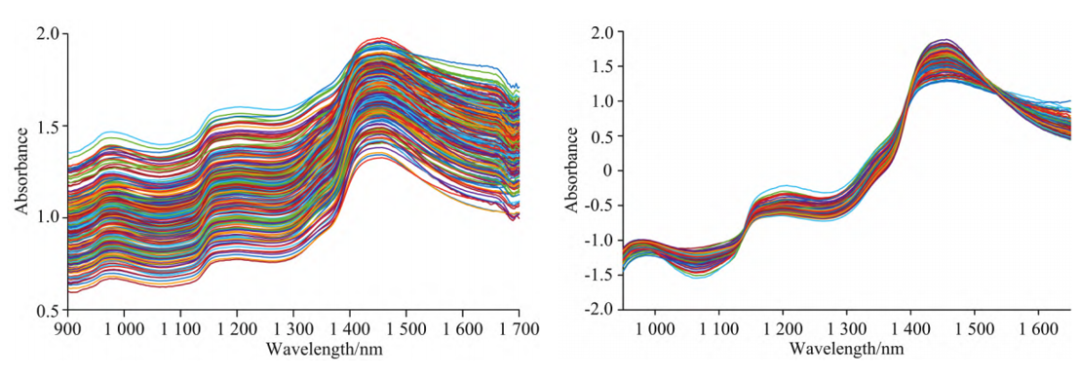
Figure2 Original NIR spectrum of tomato(Left);NIR spectrum of tomato after preprocessing(Right)
Detection of soluble solids content (SSC) of tomato cherry tomatoes based on visible/near-infrared reflectance spectroscopy
The visible/near-infrared spectrum collection system used by Henan University of Science and Technology includes a miniature fiber optic spectrometer (wavelength range 350~1000nm), light source, optical fiber, optical fiber probe and computer-based experimental platform. The sample selected 188 cherry tomatoes with intact fruits, no cracks, and similar appearance colors. Measurements were performed in a dark environment with the fiber optic probe held close to the sample surface. Measure 2 sets of data for each sample and take the average value as the sample spectrum data. Eliminate the noisy areas and select data in the wavelength range of 481~800nm for analysis. SG smoothing, normalization (NOR), and standard normal variable transformation (SNV) were used to preprocess the spectral data. 18 characteristic variables are extracted through the CARS algorithm to determine the characteristic wavelength as shown in Figure 4. An IBP model was established for 18 variables, so that R2 and RMSE were 0.997 and 0.0479 respectively.
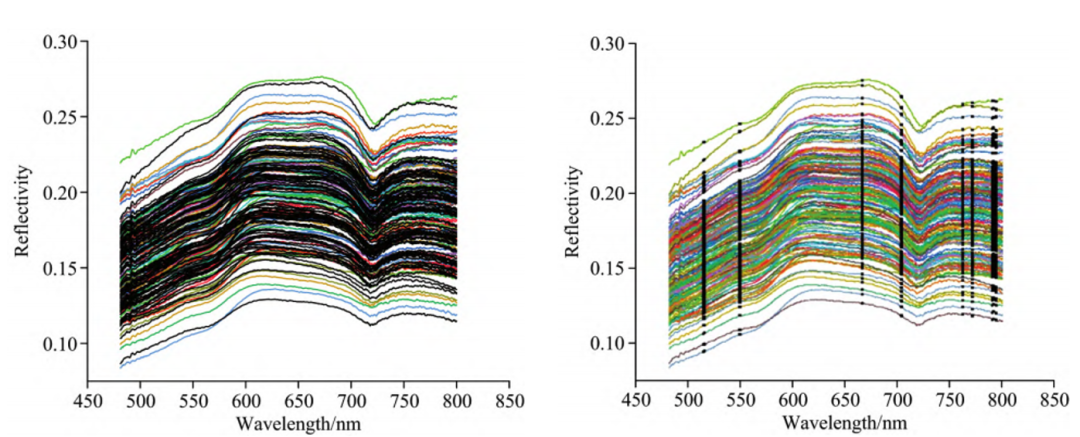
Figure 4 Original spectral reflectance curve (left) ;Spectral average reflectance curve after CARD selects characteristic wavelengths (right)
Summarize
Spectroscopic technology is becoming increasingly popular in agricultural product testing. And the non-destructive testing of fruit quality using spectral technology has become a research hotspot in recent years. Many scholars at home and abroad have successively carried out research on non-destructive testing of the quality of citrus, apples, pears, peaches, or other agricultural food and have achieved fruitful results. ATP8000 near-infrared spectrometer can be used to build a non-destructive testing system for fruits. There is also a special instrument, the NY2000 portable fruit non-destructive sugar meter, which can directly detect the sugar content of fruits without picking, cutting or extracting juice. The ATZW300 fruit acidity and sweetness measuring instrument uses the different absorption degrees of different internal components of fruits to different wavelengths, and uses chemometrics methods to establish an analysis model (customer-built model) based on the near-infrared spectral characteristics, which can be achieved without destroying the sample. Realize rapid analysis of fruit sugar content, acidity and other indicators. In addition, it can analyze internal lesions and defects by establishing a discrimination model (customer-built model) for specific fruits, and cooperate with the fruit sorting system for fast and accurate online sorting.
Optosky Wuhan R&D Center Product Introduction
Talk about the application of near-infrared spectroscopy technology in the petrochemical field
Related Article
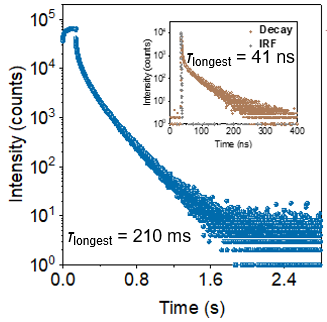
This article mainly describes the application of fluorescence spectrometer in the development of organic room temperature phosphorescent materials.
Fluorescence Spectrometer Develops Organic Room-Temperature Phosphorescent Materials

This article highlights the advantages of near-infrared (NIR) spectroscopy for real-time moisture analysis, focusing on its non-destructive nature and precision. It features a case study on silica granulates in the rubber industry, showcasing how accurate moisture measurements can enhance quality and efficiency. The piece encourages businesses across various sectors to leverage NIR technology for better decision-making and operational improvements.
NIR Spectroscopy for Measuring Moisture in Granulates
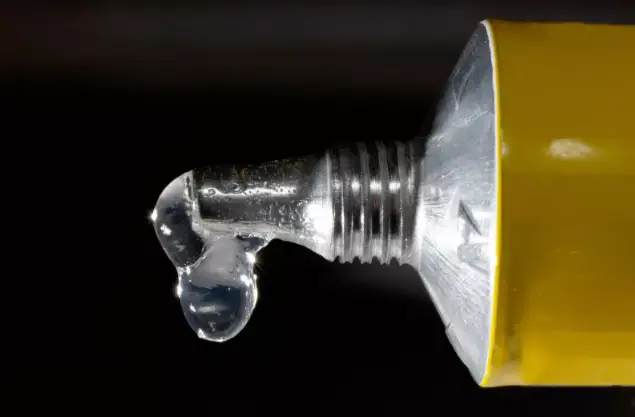
Unlock the potential of Near-Infrared (NIR) spectroscopy for monitoring epoxy resin curing. This non-destructive method provides real-time, precise insights, enhancing product quality in manufacturing and 3D printing. Discover more in our application note!
Quantitative Evaluation of Epoxy Resin Using NIR