
Solution Recommendation | Micro-Raman Spectrometer Assists the Research of Lithium-ion Batteries
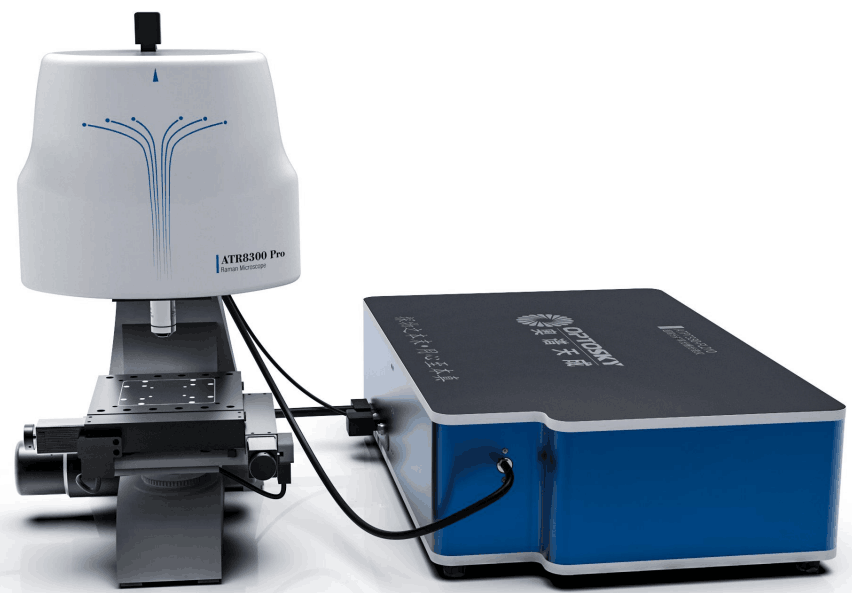
Lithium-ion batteries are a high-performance, lightweight and rechargeable battery technology that are popular for their high energy density and are widely used in mobile energy fields such as portable electronic devices and electric vehicles. As the demand for energy storage continues to increase, the performance optimization and safety of lithium-ion batteries have become a hot research topic. In lithium-ion battery research, Micro-Raman Spectrometer has become a powerful tool that can provide detailed information about the internal structure, chemical composition and kinetic processes of the battery. This article will introduce the application of Micro-Raman Spectrometer in lithium-ion battery research, and discuss its important role in electrode material analysis, solid electrolyte research, battery kinetics research, surface modification research, and anode electrode film observation.
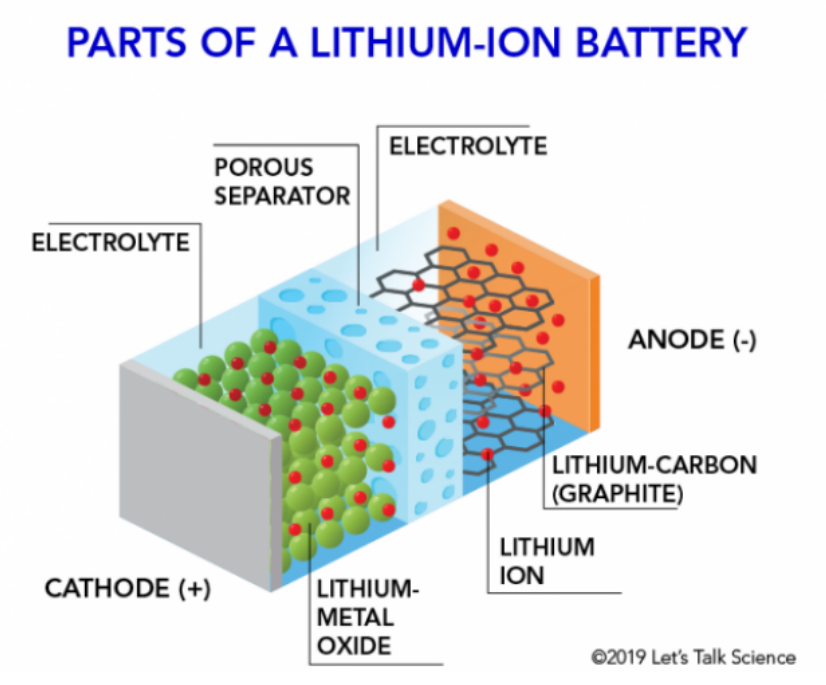
Image Source: Let’s Talk Science
The performance of lithium-ion batteries is closely related to the structure and chemical composition of the electrode materials. The cathode and anode materials for lithium batteries undergo complex electrochemical reactions during the lithium insertion and extraction processes. Micro-Raman Spectrometer can clearly observe the microstructure and chemical changes of these electrode materials.
The cathode material in lithium-ion batteries is usually a layered structure oxide, such as lithium cobalt oxide (LiCoO2), lithium manganate (LiMn2O4), lithium cobalt nickel oxide (LiNi1-yCoyO2), etc. The crystal structure of these materials changes as lithium ions are inserted and extracted. Through Micro-Raman Spectroscopy, researchers can observe changes in lattice vibration modes to understand the process of lithium-ion insertion and extraction. For example, Kostecki et al. used Micro-Raman Spectroscopy technology combined with electrochemical analysis to obtain a map of the chemical composition and structural information of the LiNi0.8Co0.15 Al0.05O2 electrode after charging and discharging.
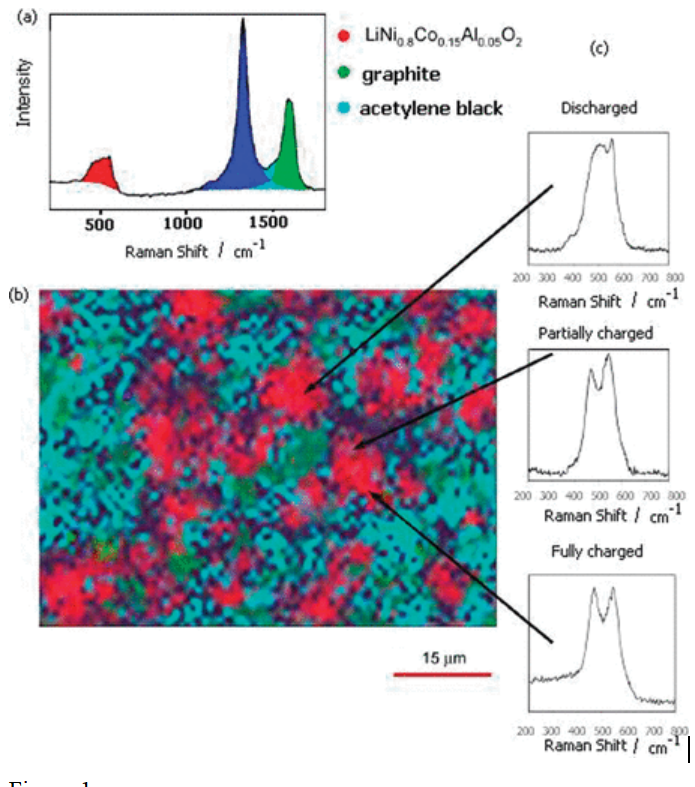
Figure 1
- Average Raman spectroscopy of LiNi0.8Co0.15Al0.05O2 electrode;
(b)52μm×75μm Raman mapping image of the composite LiNi0.8Co0.15Al0.05O2 electrode of the cycle battery. The intensity of red, blue and green corresponds to the intensity of LiNi0.8Co0.15Al0.05O2 and graphite D and G bands of each spectroscopy respectively;
(c)Micro-Raman spectroscopy of three individual LiNi0.8Co0.15Al0.05O2 particles on the electrode.
Graphite-like carbon materials have the advantages of high capacity and good cycle stability, and are the most commonly used anode electrode materials in lithium batteries. The Raman spectroscopy of graphite materials has two Raman peaks between 1000 and 2000cm-1, namely the E2g2 mode vibration (G band peak) at 1582cm-1 and the A1g mode vibration (D band peak) at 1330cm-1.The G band peak originates from the sp2 stretching vibration of carbon atoms, which is a characteristic peak of graphite, while the D band peak originates from the breathing vibration of carbon rings, which is related to lattice defects and disorder in the material. Therefore, the peak intensity ratio of the D and G bands (ID/IG) can be used to reflect the degree of graphitization of the carbon material. The smaller the ID/IG, the fewer defects the carbon material has and the higher the degree of graphitization. Graphite deteriorates during the process of charging and discharging. The ID/IG ratio of the D and G bands of the Raman spectroscopy is related to structural damage. The increase in the intensity of the D band relative to the intensity of the G band indicates an increase in the structural defects of graphite.Therefore, Raman imaging can clearly show the changes in the graphite structure. So, ID/IG can be used to characterize the degree of damage to graphite-like carbon materials during the process of charging and discharging.
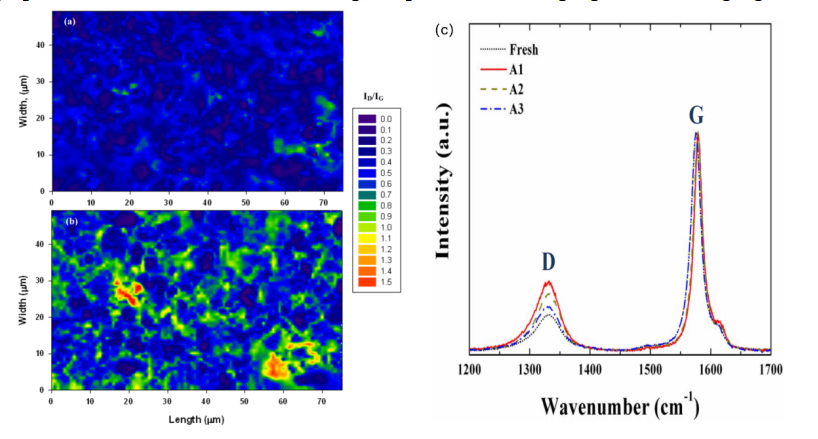
Figure 2
- Raman mapping images before cyclic charging and discharging;
- (b)Raman mapping images after cyclic charging and discharging;
- Raman spectroscopy of graphite after different cycles.
Traditional lithium-ion batteries use liquid electrolytes, but solid electrolytes have attracted much attention due to their potentially high safety and stability. Through Micro-Raman spectroscopy, the structure, crystal defects, interface chemistry, ion diffusion, chemical composition and performance response of solid electrolytes can be analyzed. By observing changes in vibrational patterns, researchers can learn about the electrolyte's crystal structure, ionic conductivity and electrochemical properties. This plays an important role in improving battery technology, optimizing electrolyte performance and stability, and understanding the chemistry and electrochemical processes at the interface.
Figure 3
- In situ Raman spectroscopy of LixMn2O4 cathode surface during charging in thin film batteries;
- In situ Raman spectroscopy of LixMn2O4 cathode surface during discharging in thin film batteries;
- Correlation diagram of Raman peak intensity, current and potential at 587cm-1
Overall, Micro-Raman spectroscopy plays an integral role in lithium-ion battery research. It provides high-resolution structural and chemical information to help optimize battery design, improve battery performance, extend battery life, and contribute to the development of clean energy and electric transportation. With the continuous advancement of technology, Micro-Raman Spectrometer will continue to provide more accurate and valuable information for lithium-ion battery research, promoting the continuous innovation and improvement of energy storage technology. This advanced tool will play a greater role in the future energy fields, accelerating the spread of clean energy and reducing dependence on limited fossil fuels.
Technical Report—Raman Spectroscopy Detection of SERS Substrate Samples
A detection method of small-sized microplastics based on micro-Raman mapping
Related Article
