
Raman Spectroscopy for Geological Materials Analysis
2024-01-16
Introduction
Natural rocks composing the Earth are complex.They consist of an aggregate of one or more minerals. Each mineral can be defined by its chemical composition and its crystalline structure and sometimes can also contain fluid inclusions. Geologists need a powerful characterization technique to get detailed information on the rock formation history. Raman spectroscopy is extremely in-formation-rich (chemical identification, characterization of mole-cular structures, effects of bonding, environment and stress on a sample). With its non-destructive properties and high spatial re-solution (< 1 um), it is thus a tool of choice for geological studies.
Raman Spectroscopy Specificities
The Raman effect is highly sensitive to even slight differences in chemical structures. Even if not all vibrations are observable with Raman spectroscopy (depending on the symmetry of the mole-cule or crystal),sufficient information can be obtained to discriminate different structural groups or phases related to the same mineral class, like silicates or carbonates.
Sometimes a high spectral resolution is needed to resolve closely spaced peaks.This is the case when specific pressure and temperature conditions are applied to a mineral using for example a diamond anvil cell (DAC) to recreate what can happen deep in the earth. Indeed spectral discrimination will be the key factorto detect small peak shifts induced by high pressure and temperature conditions.
Systems offering multiple laser excitations can efficiently counter the possible fluorescence of geological samples. Coupled to confocal microscopy, Raman spectroscopy provides information with high spatial resolution (< 1 um).
On-site analysis can also be undertaken with mobile units possibly by using remote sampling accessories.
Raman spectral libraries are also a great help for easy identification of minerals, relying on supplier's libraries or on data-bases created by the end-user.
Chemical selectivity
a-Silicate minerals
The silicate minerals,often designated simply by the term“silicates", represent the most important class of rocks forming the crust and mantle of the Earth. A silicate is a compound whose skeleton is essentially composed of silicon and oxygen tetrahedra and with additional elements such as aluminum (aluminosilicates), magnesium,iron,calcium, potassium, etc.They are classified based on the mode in which the silicate groups coalesce.The Raman spectra of the different classes of silicate minerals provide rapid identification of the particular class. Figure 1 indicates some of the arrangements of fused tetrahedra that are possible.

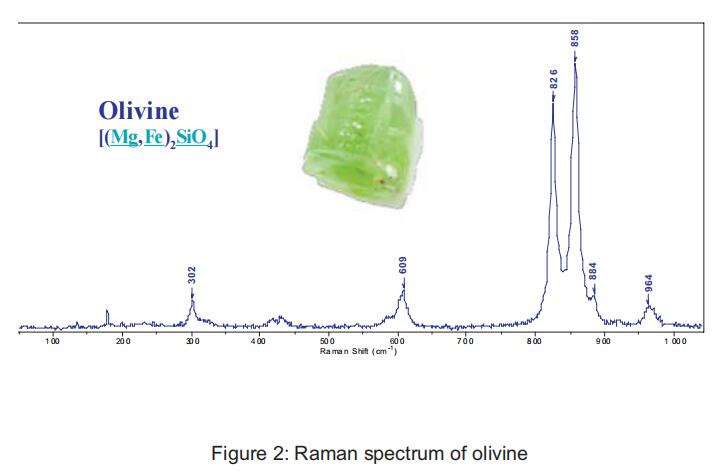
Olivine is one of the most common minerals of the igneous rocks type (formed by magma). lt belongs to the nesosilicates (or or-thosilicates) subclass characterized by an isolated tetrahedra [SiO4]4-. Its Raman spectrum shows intense stretching modes in the 800-1000 cm-1 region and bending modes between 300 and 650 cm-1. (Figure 2)
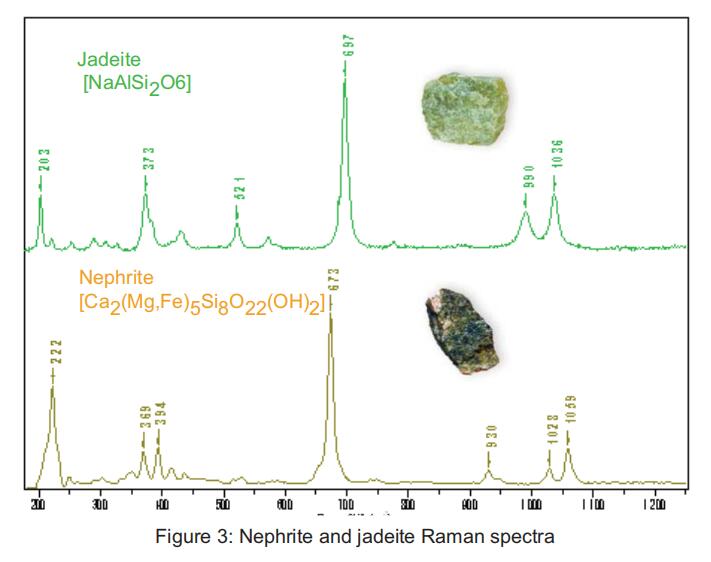
The term inosilicates is used for chain silicates. They are divided in two groups: pyroxenes and amphiboles. Pyroxenes contain single chains of SiO4 groups. Like jadeite, their spectra present an intense Raman band between 650 and 700 cm-1. In contrast to the single chain structure of pyroxenes, amphiboles contain double chains of tetrahedra. One representative amphibole mineral is actinolite and its variety nephrite. Both jadeite and nephrite are recognized as the gemstone jade (Figure 3).
Feldspars and zeolites belong to the tectosilicates groups, also known as three-dimensional framework silicates. Feldspars can have three end-membered elements: potassium (orthoclase), so-dium (albite) and calcium (anorthite). A variation in peak positions, especially for the peaks near 500 and 280 cm-1 can be used to discriminate between them.
Because of their porous properties, zeolites are rarely pure and numerous types of zeolite frameworks exist. A natrolite spectrum is given for example (Figure 4). The most intense band at 532 cm-1 corresponds to the breathing mode of the four-membered alu-mino-silicate ring .

b- Carbonates
Like silicates, carbonates are minerals that are present in abundance on the surface of the Earth. They are characterized by the presence of a carbonate ion CO32-and Raman spectra are slightly different depending on the divalent cation (Ca2+,Fe2+, etc) coor-dinated to the carbonate ion. Frequency shifts can be observed in two spectral areas:
- between 120 and 450 cm-1- this region indicates crystallographic structures
- between 1080 and 1100 cm-1 - this band is specific to the carbonate ion CO32-
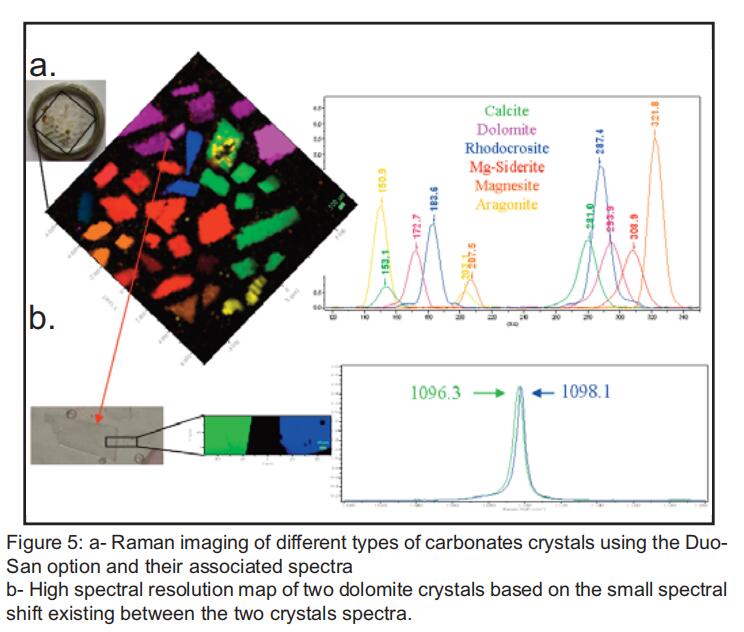
A test sample containing different species of carbonates has been fully imaged using the DuoScan option in macro-mapping mode. Average spectra in pixels of 200 um2 have been collected on a surface of about 1 cm2 in less than an hour. The low frequency region has been studied and six different species have been easily detected.Their distribution and associated spectra are given in the figure 5a.
Another map in traditional point-by-point mode has been carried out on a small area containing only two dolomite crystals. The high spectral resolution of the LabRAM HR has enabled detection of the small frequency shift existing between the two carbonates, the green one having traces of Fe (Figure 5b).
Silicate and carbonate classes contain numerous species, each of them having characteristic Raman bands. Raman spectroscopy is thus an ideal technique to quickly identify them.
Fluid inclusions and confocality
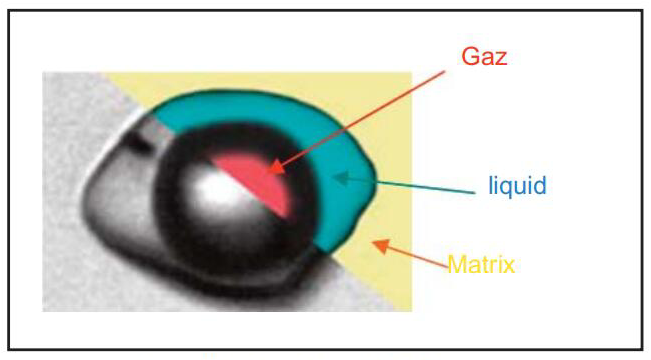
Minerals often contain fluids or solids which have been trapped during the formation of the crystal and thus can provide information about the conditions existing during the mineraliziation (composition,temperature, pressure...). Liquid or gas bubbles are called fluid inclusions. Their size ranges from less than a micrometer to several hundred micrometers in diameter.A Raman system coupled to a confocal microscope is required to obtain highspatial resolution and to analyse inclusions located below the surface without destruction.
a- Principle of confocality
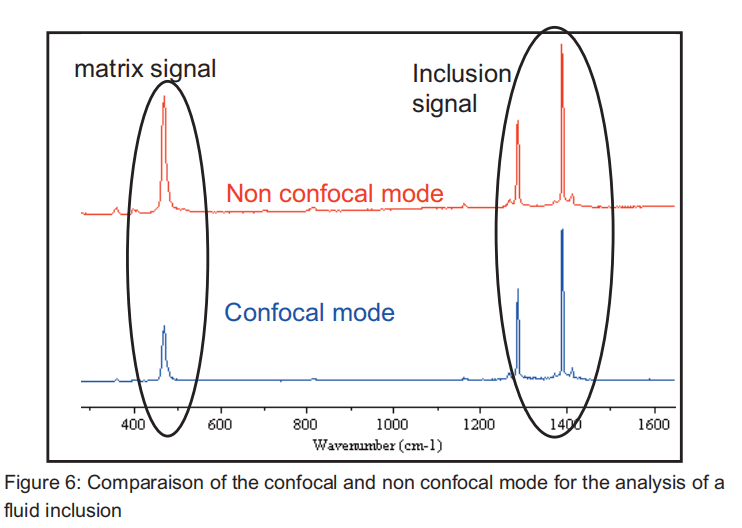
In a confocal microscope, an adjustable pinhole is optically conjugated to the sample. Thus, all out-of-focus radiations can be rejected from the collected Raman signal. For example,if the pinhole is closed enough, a small embedded inclusion signal is efficiently discriminated from the matrix signal. The figure 6 illustrates this principle. ln confocal mode, the signal of the matrix is less visible than in the non-confocal mode.
b- Point measurements
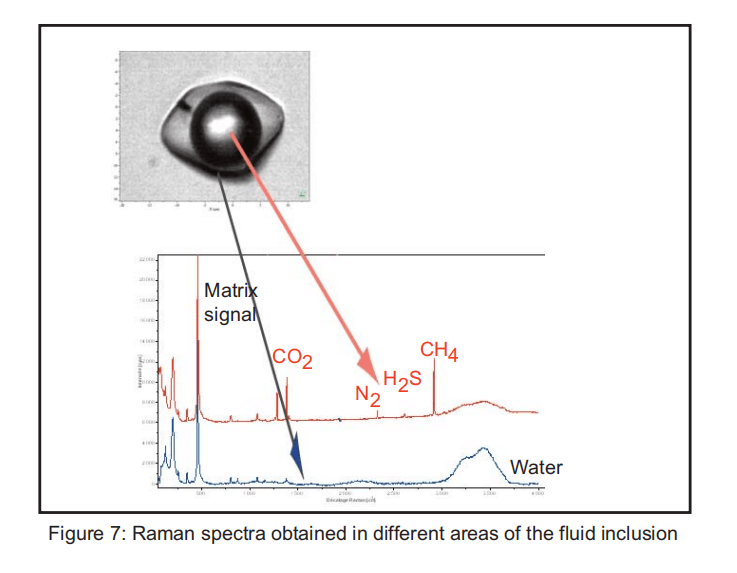
Raman analysis of a 20 um fluid inclusion embedded in a quartz matrix was carried out on the LabRAM HR. The inclusion is a two phase system, where the gas phase consisting of a mixture ofCO2 (1285 cm-1 and 1388 cm-1), CH4 (2914 cm-1),N2 (2331 cm-1)and H2S (2611 cm-1) in enclosed in the liquid phase (3200-3700cm-1) (Figure 7)
c- Imaging
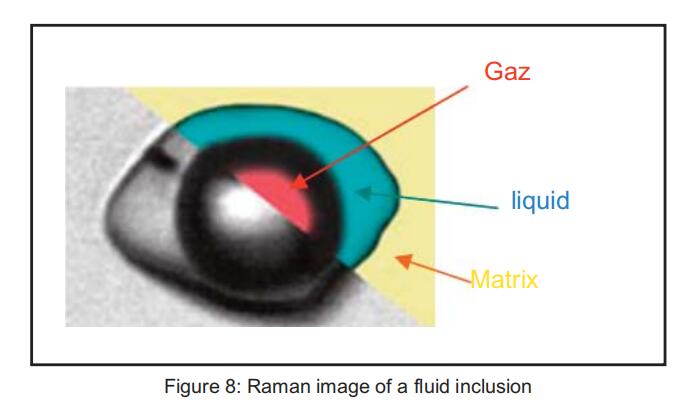
The high spatial resolution of the system, better than 1 um, enables one to image the components of the fluid inclusion presentes in the example above and so highlight the distribution of the different phases (Figure 8).
d-Use of a corrected objective
Fluid inclusions are embedded in a transparent or semi-transparent matrix with an index of refraction higher than 1.4. For matrix having an index of refraction close of this glass, the use of a dry objective with cover slip correction can be a solution to minimize the degradation of the lateral and axial resolutions implied by the drastic change of the index.
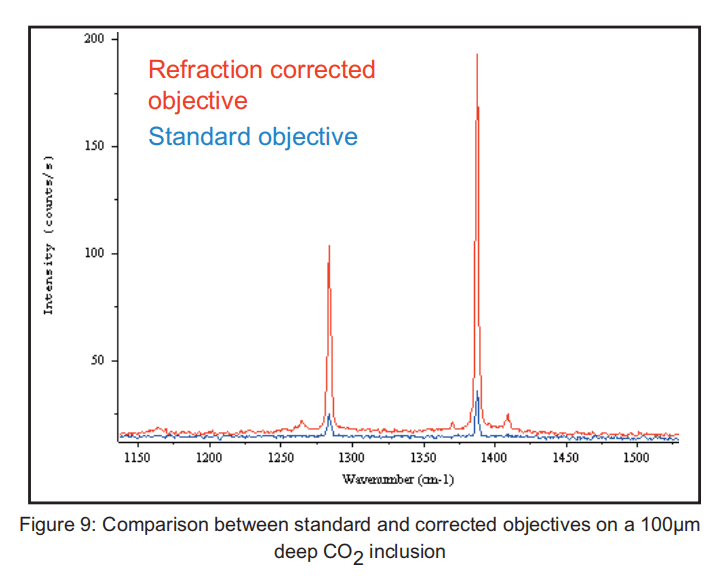
A test was performed on a CO2 bubble embedded 100 um deep in a quartz matrix (Figure 9).
The Raman peaks of the CO2 (1285 and 1388 cm-1) are much stronger when using the corrected objective because the corrections provide better collection efficiency and focus on the entrance slit of the spectrograph.
Because of their size and location in minerals, fluid inclusions can be hard to analyze. With its high spatial resolution,Raman spectroscopy is very useful to determine the composition of the embedded fluids. Imaging of fluid inclusions is also possible and the use of corrected objective can help to obtain higher signals.
Conclusion
Raman spectroscopy is a practical exploration tool to study geological materials. This technique is a rapid and reliable way to confirm, for example, that a geological sample is really a jade gemstone, or that its composition is dolomite. Chemical information can be obtained without any extraction procedure or sample preparation. Thus, the analysis can be achieved in situ and if necessary directly at the geological site. Raman imaging is also useful to study heterogeneous samples provided by the various fields of application of Earth Science: mineralogy, gemmology, petrology, geoarcheology, paleontology, planetology or volcanology.By the mean of this vibrational technique, the complex history of the Earth can be better understood.
An Exceptional View of Geological Materials with Raman Imaging
Raman Spectrometer In Food Safety (Additive Detection)
Related Article

Discover how Raman spectroscopy enables label‑free cancer diagnosis by reading molecular fingerprints of cells. From key Raman peaks and AI‑powered classification to the ATR8800 confocal platform, this article explores the frontiers, challenges, and clinical potential of Raman‑based cancer detection.
How Raman Spectroscopy Sees Through Cancer Cells: Label‑Free Cancer Diagnosis
Optosky successfully delivered and commissioned multiple ATP9100 field spectroradiometers at a university in Northwest China. The project included installation, performance verification, and on‑site training – supporting agricultural remote sensing, ecological monitoring, and geological surveys while building a standardized spectral research platform.
Case Study | ATP9100 Acceptance at Northwest University

Raman peaks don't lie — if you know how to read them.
Let's have a look!
Let's have a look!
Raman Characteristic Peaks – A Short Summary
Want to know details of ATR3100 Portable Raman Spectrometer Introduction ? Leading supplier - Optosky will share knowledge of portable Raman spectrometer , cooled CCD Raman , high‑sensitivity Raman for you. Click the link to get more information.
ATR3100 Portable Raman Spectrometer Introduction