
Applications | Raman Mapping in Practice: Surface Distribution Analysis of Four Molecular Samples
Recently, we completed a set of Raman mapping scans for a university, covering both standard compounds and bioactive molecules. The entire experimental process was quite representative, and we would like to share this real‑world case to illustrate how a laser micro‑Raman spectroscopic imaging system delivers value in scientific research.
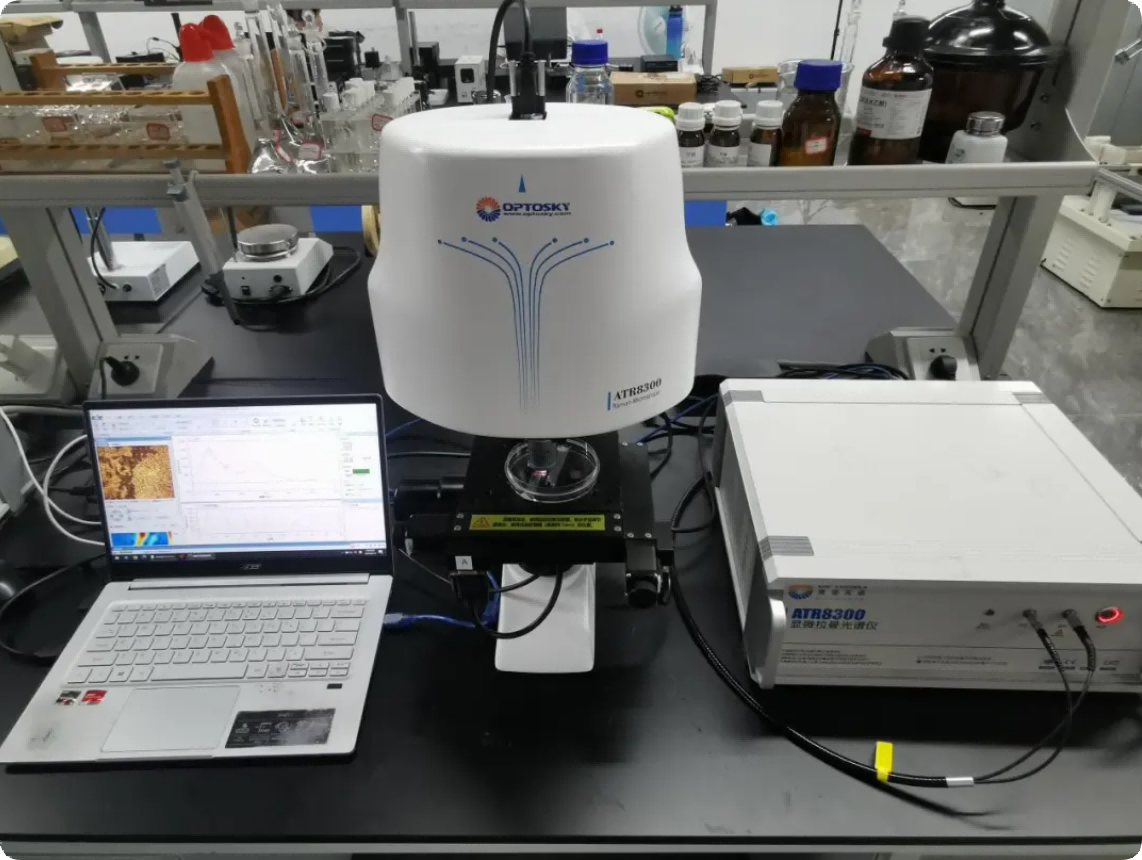
The core task of this test was not simply to collect a single Raman spectrum, but to obtain spatial distribution information of substances on the sample surface via mapping scanning. This places higher demands on the instrument – ensuring spectral quality at each sampling point, while also balancing scanning efficiency and stability, and ultimately converting signal intensities into intuitive pseudo‑colour distribution maps.
Test Condition
- Instrument model: ATR8300MP‑785 Laser Micro‑Raman Spectroscopic Scanning Imaging System
- Excitation wavelength: 785 nm (near‑infrared)
- Test samples: 4‑Mercaptobenzonitrile / Cortisol / Dopamine / Dehydroepiandrosterone (2 parallel samples each)
- Laser power: 200 – 400 mW (optimised per sample)
- Integration time: 2 – 20 s (optimised per sample)
- Test mode: Mapping scanning imaging
01 Why Choose 785 nm Excitation Wavelength?
For this test, we used the ATR8300MP‑785 Laser Micro‑Raman Spectroscopic Scanning Imaging System with an excitation wavelength of 785 nm. Researchers working with biological samples and organic molecules are well aware that wavelength selection is a trade‑off.
The 532 nm short wavelength offers a larger Raman scattering cross‑section and stronger signals, but also suffers from high fluorescence background – many biological samples show a broad fluorescence hump that completely overwhelms characteristic peaks. The 785 nm near‑infrared excitation significantly suppresses fluorescence interference. Although absolute signal intensity is somewhat lower, for biomolecules prone to fluorescence, such as cortisol and dopamine, obtaining clean spectra is more important than maximising signal strength.
The laser micro‑imaging design of the ATR8300MP is equally critical. The instrument only collects signals from the focal spot micro‑area, effectively rejecting out‑of‑focus interference and achieving micrometre‑scale spatial resolution. For surface distribution analysis, this precision is an indispensable foundation.
02 Experimental Design: Four Molecules, Two Parallel Sets
The four target molecules in this test have distinctly different Raman characteristics:
- 4‑Mercaptobenzonitrile (4‑MBA)
A common Raman labelling molecule. The thiol group can bind to metal substrates, and the nitrile group exhibits a very characteristic sharp peak near 2200 cm⁻¹. It is one of the most classic reporter molecules in SERS studies.
- Cortisol · Dehydroepiandrosterone (DHEA)
Both are steroidal hormones with relatively large molecular weights and small Raman scattering cross‑sections, presenting a real challenge to instrument sensitivity and signal‑to‑noise ratio.
- Dopamine
An important neurotransmitter and the weakest signal among this set, also most prone to fluorescence interference, requiring the most demanding test conditions.
Two parallel samples were prepared for each compound. During the test, laser power and integration time were individually optimised based on pre‑scan results: power ranging from 200 to 400 mW, and integration time from 2 seconds to 20 seconds.
Key point: There is no universal "one‑size‑fits‑all" parameter set – only the optimal choice tailored to the sample's characteristics.
03 Test Results: Visible Distributions
First, 4‑mercaptobenzonitrile – the best‑performing sample in the entire experiment. Under 400 mW and 8 s integration, the characteristic peaks are very sharp and clear, and the mapping pseudo‑colour image intuitively reflects the actual distribution state of the sample on the substrate surface.
Figure 2 – 4‑Mercaptobenzonitrile (Sample 1) · 400 mW / 8 s
For cortisol, integration times were set to 10 s (Sample 1) and 20 s (Sample 2) – after all, the Raman cross‑section of biological hormones cannot be compared with standard compounds. The results were satisfactory: the typical vibrational peaks of the steroidal skeleton are clearly distinguishable, and the mapping images show meaningful signal distributions rather than random noise.
Figure 3 – Cortisol (Sample 1) · 400 mW / 10 s
Dehydroepiandrosterone (DHEA) achieved good signal response under 400 mW and just 2 s integration. The spectral features and distribution trends between the parallel samples are highly consistent, indirectly confirming the instrument's stability.
Figure 4 – Dehydroepiandrosterone (Sample 1) · 400 mW / 2 s
Dopamine was relatively more challenging. Under the current test conditions (200 mW, 2 s integration), we observed signal response, but the identification and assignment of its typical Raman characteristic peaks still have room for further optimisation. This is actually normal in research – not every sample yields a perfect spectrum on the first attempt. Appropriate SERS enhancement substrates, optimisation of sample preparation, and longer integration times are all worthwhile directions to explore.
Figure 5 – Dopamine (Sample 1) · 200 mW / 2 s
04 Parallel Sample Verification: Repeatability Is the Golden Rule
Those in research know that even the most beautiful single measurement is not enough – repeatability is the gold standard for data reliability. In this test, two parallel samples were measured for each compound, and the spectral features and mapping distribution trends between the two datasets were highly consistent.
Figure 6 – 4‑Mercaptobenzonitrile (Sample 2) · 400 mW / 20 s
Figure 7 – Cortisol (Sample 2) · 400 mW / 20 s
Figure 8 – Dehydroepiandrosterone (Sample 2) · 400 mW / 2 s
Figure 9 – Dopamine (Sample 2) · 200 mW / 2 s
05 Core Value of the Instrument in This Experiment
- 785 nm excitation effectively suppresses fluorescence background
Cortisol and dopamine are both high‑fluorescence‑risk samples. With a shorter wavelength, characteristic peaks would easily be overwhelmed by fluorescence. This is not something that post‑processing can fully correct – the choice must be made at the excitation source.
- Flexible parameters adapt to samples with different characteristics
A power adjustment range of 200–400 mW and selectable integration times from 2 to 20 s allow operators to quickly lock on optimal conditions for molecules with vastly different signal strengths, rather than using a single set of parameters to scan all samples.
- System stability supports long‑duration mapping acquisition
Area scanning often runs continuously for tens of minutes. Laser power drift and spectral peak shifts directly affect the quality of distribution maps. The high consistency between the two parallel samples indirectly demonstrates the system's reliable performance.
06 Core Value of the Instrument in This Experiment
People often ask: what can a Raman spectrometer actually measure? The truth is, there is no single answer. The instrument is a tool – an extension of the researcher's eyes and hands. From standard compounds to biological hormones, from single‑point spectra to two‑dimensional distributions, the same instrument can answer completely different scientific questions under different experimental designs.
4‑Mercaptobenzonitrile produced beautiful peaks; dopamine still has room for optimisation – and that is what real research looks like. No instrument can guarantee perfect spectra for every sample, but a good instrument should deliver reliable, repeatable results in most cases, allowing you to focus your energy on the truly important scientific questions – rather than wrestling with the equipment.
For more information, please contact:
Email: [email protected]
Web: www.optosky.net
ATR3100 Portable Raman Spectrometer Introduction
Product Upgrade | ATR8800 Comprehensive Upgrade: Faster · More Precise · Sharper
Related Article
