
Raman Spectroscopy: The "Structural Tool" for Biomass Electrode R&D
2025-12-12
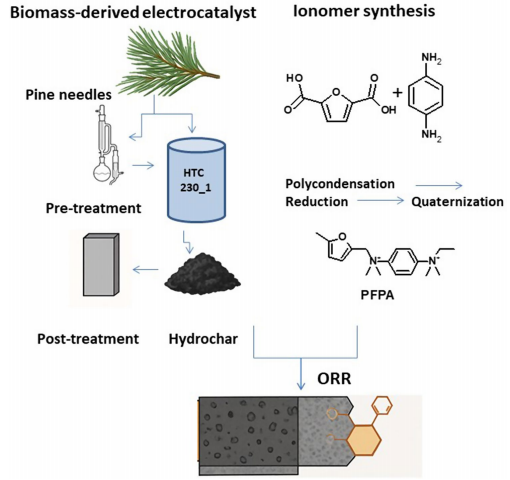
In the sustainable advancement of anion exchange membrane fuel cells (AEMFCs), breakthroughs in biomass-derived electrode performance rely heavily on the robust capabilities of Raman spectroscopy. It penetrates material surfaces to reveal the core secrets of carbon structure, providing precise guidance for process optimization and performance enhancement—valuable insights accessible to both novices and experts alike.
Why Raman Spectroscopy is Essential?
Common challenges in biomass electrode development include: Why do different processes yield significantly varied performance? Can pre‑treatment and high‑temperature post‑treatment truly optimize structure? What is the relationship between carbon structure and catalytic activity?
These questions cannot be answered by visual inspection or conventional analytical methods. Raman spectroscopy, however, uses three key indicators—the D‑band (defects/disordered carbon), the G‑band (graphitized/ordered carbon), and the ID/IG ratio—to make hidden structural differences immediately clear, enabling straightforward problem‑solving.
3 Core Applications Addressing Key Research Challenges
① Process Screening: Rapidly Identify the Optimal Solution
Comparison of three pine‑needle‑derived biochar processes using Raman data directly reveals the best option:
Comparison of three pine‑needle‑derived biochar processes using Raman data directly reveals the best option:
-
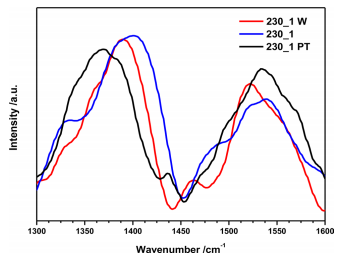
Pre‑treatment + HTC (230_1): ID/IG = 1.65 (highest), most disordered structure. Solvent pre‑treatment removes aromatic “raw materials” and causes environmental pollution—not recommended.
-
Direct HTC (230_1 W): ID/IG = 1.35 (medium), retains original components, balances environmental friendliness and performance—the cost‑effective choice.
-
Direct HTC + high‑temperature post‑treatment (230_1 PT): ID/IG = 1.15 (lowest), most ordered structure, but high energy consumption makes the performance gain uneconomical.
Without requiring full electrochemical testing, Raman spectroscopy enables preliminary screening of the optimal process, reducing ineffective R&D efforts.
②Structural Quantification: 3 Indicators Define Order Degree
No complex calculations needed—three indicators quickly “score” carbon structure:
No complex calculations needed—three indicators quickly “score” carbon structure:
-
Lower D‑band position → fewer defects (230_1 PT as low as 1360 cm⁻¹).
-
Higher G‑band position → stronger graphitization (230_1 PT up to 1540 cm⁻¹).
-
Smaller ID/IG → higher order degree (1.15 < 1.35 < 1.65).
Accurate quantification of graphitization degree and defect density lays the foundation for further analysis.
③Performance Prediction: Bridging Structure and Performance
Raman data can predict electrode performance in advance:
Raman data can predict electrode performance in advance:
-
230_1 PT (highest order) → highest electron transfer number (2–2.5).
-
230_1 W (moderate order) → current density reaches 3.5 mA/mg at 2500 rpm, better for practical applications.
-
230_1 (high disorder) → hindered electron transport, weaker performance.
Structural indicators can guide R&D direction without repeated electrochemical testing.
Practical Tips: 4 Key Guidelines
-
Focus measurement on 1300–1600 cm⁻¹ to avoid irrelevant signals.
-
Calculate ID/IG using peak‑area fitting, not simple peak‑height ratios, to minimize bias.
-
Interpret data in conjunction with process conditions for meaningful optimization guidance.
-
Do not blindly pursue higher order; balance performance with energy consumption.
Reference
Chandrasekaran S, Narducci R, Sgreccia E, et al. Sustainable electrodes based on biomass‑derived catalysts and Ionomers for the Oxygen Reduction Reaction[J]. Journal of Materials Science: Materials in Energy, 2025, 1(1): 7.
Chandrasekaran S, Narducci R, Sgreccia E, et al. Sustainable electrodes based on biomass‑derived catalysts and Ionomers for the Oxygen Reduction Reaction[J]. Journal of Materials Science: Materials in Energy, 2025, 1(1): 7.
Follow us for more cutting‑edge Raman technology applications and solutions!
Email: [email protected]
Email: [email protected]
Product Upgrade | ATR8800 Comprehensive Upgrade: Faster · More Precise · Sharper
Raman Advantage — Technical Analysis Comparison
Related Article

Discover the Optosky ATR1600 ultra-micro Raman spectrometer—a 210g pocket-sized device for on-site, non-destructive gemstone identification. With a 20,000+ substance spectral library, dedicated jewelry edition, Bluetooth smartphone APP, and PDF reporting, it enables rapid screening of natural, synthetic, and treated gemstones at exhibitions, pawnshops, and markets.
ATR1600: The 210g Pocket Raman Gem Identifier
Explore how micro-confocal Raman spectroscopy, combined with SERS, enables rapid, non-destructive, molecular-level screening of veterinary drug residues such as malachite green, enrofloxacin, and chloramphenicol in aquatic products. Learn how Optosky’s ATR8100 supports microscopic localization, multi-wavelength excitation, mapping imaging, and portable on-site testing—while clarifying its role alongside LC-MS/MS confirmation.
Applications | Micro-Raman Drug Residue Screening in Seafood
Discover how Raman spectroscopy enables label‑free cancer diagnosis by reading molecular fingerprints of cells. From key Raman peaks and AI‑powered classification to the ATR8800 confocal platform, this article explores the frontiers, challenges, and clinical potential of Raman‑based cancer detection.
How Raman Spectroscopy Sees Through Cancer Cells: Label‑Free Cancer Diagnosis
Optosky successfully delivered and commissioned multiple ATP9100 field spectroradiometers at a university in Northwest China. The project included installation, performance verification, and on‑site training – supporting agricultural remote sensing, ecological monitoring, and geological surveys while building a standardized spectral research platform.
Case Study | ATP9100 Acceptance at Northwest University