Aluminum industry operating characteristics and situation analysis
In October 2023, China's aluminum smelting industry prosperity index was 32.6, up 1.3 points from the previous month and at the lower end of the "normal" range; the leading composite index was 54.3, down 0.1 points from the previous month. The prosperity index of China’s aluminum smelting industry in the past 13 months is shown in Table 1.
Table 1 China’s aluminum smelting industry prosperity index in the past 13 months
|
Month |
Leading synthetic index (2005=100) |
Consensus synthetic index (2005=100) |
Lagging composite index (2005=100) |
Prosperity index |
|
October 2022 |
59.1 |
109.6 |
109.6 |
40.0 |
|
November 2022 |
58.8 |
107.9 |
104.1 |
39.3 |
|
December 2022 |
59.0 |
106.7 |
100.2 |
39.0 |
|
January 2023 |
59.1 |
104.7 |
98.4 |
38.1 |
|
February 2023 |
58.9 |
100.9 |
97.6 |
36.0 |
|
March 2023 |
58.2 |
95.5 |
96.2 |
32.8 |
|
April 2023 |
56.8 |
89.8 |
93.0 |
29.0 |
|
May 2023 |
55.2 |
85.3 |
88.0 |
25.9 |
|
June 2023 |
54.1 |
83.0 |
82.7 |
24.3 |
|
July 2023 |
53.8 |
82.6 |
78.5 |
24.4 |
|
August 2023 |
54.1 |
83.4 |
76.1 |
25.3 |
|
September 2023 |
54.4 |
84.9 |
75.4 |
31.3 |
|
October 2023 |
54.3 |
87.4 |
76.1 |
32.6 |
The prosperity index is within the normal range and increased from the previous month.
In October 2023, China's aluminum smelting industry prosperity index was 32.6, an increase of 1.3 points from the previous month and at the lower end of the "normal" range. The trend of the monthly prosperity index of China’s aluminum smelting industry is shown in Figure 1.
Figure 1 China’s aluminum smelting industry prosperity index trend chart.
It can be seen from China's aluminum smelting industry prosperity signal light (see Figure 2) that in October 2023, among the 10 indicators that constitute the industry prosperity index, nine indicators including LME aluminum settlement price, M2, power generation, electrolytic aluminum production, total aluminum smelting investment, alumina production, main business income, total aluminum export volume and total profit, are all in the "normal" range; the commercial housing sales area is in the "supercooling" range.
Figure 2 China’s aluminum smelting industry boom signal light.
Leading synthetic index declines
In October 2023, the leading composite index was 54.3, down 0.1 points from the previous month. The composite index curve of China’s aluminum smelting industry is shown in Figure 3. Among the five indicators that make up the leading composite index, after seasonal adjustment, the LME aluminum settlement price remained unchanged year-on-year; one indicator fell from the previous month, with total aluminum smelting investment falling by 6.5%; three indicators increased from the previous month, with commercial housing sales area increased by 2.2%, power generation increased by 0.8%, and M2 increased by 0.6%.
Figure 3 China’s aluminum smelting industry composite index curve.
Industry operation characteristics and situation analysis
The overall prosperity of the aluminum smelting industry in October was at the lower end of the normal range, and the specific operating characteristics are as follows:
First, aluminum prices have shown a correction trend from high levels. Aluminum prices rose sharply in late September. However, aluminum prices failed to continue their upward trend in October and showed a correction trend from high levels. In early October, due to the weakening of downstream consumption, aluminum stockpiles were in a state of accumulation. Therefore, the aluminum price trend continued to be depressed after the holiday. In mid-month, due to the dry season in Yunnan, some electrolytic aluminum companies reduced production, and supported by favorable macroeconomic news, aluminum prices rebounded to a certain extent. However, due to the continuous sluggish downstream consumption, there will still be greater upward pressure on aluminum prices in the future. The main contract price of Shanghai aluminum in October was between 18,741 yuan/ton and 19,252 yuan/ton, with an average price of 18,996 yuan/ton, a month-on-month increase of 304 yuan/ton, or 1.6%, and a year-on-year increase of 767 yuan/ton, or 4.2%. The price trend of the main contract of Shanghai Aluminum is shown in Figure 4.
Figure 4 Price trends of Shanghai Aluminum’s main contracts.
Second, production remains generally stable. In September, the national electrolytic aluminum and alumina production capacity and output remained generally stable. Electrolytic aluminum companies in some areas have reduced production, mainly in Yunnan. The dry season in Yunnan is approaching, and power consumption regulation has begun to be implemented. Some electrolytic aluminum companies are required to take power load control measures in advance and implement load reduction operations. The province plans to reduce the production capacity of relevant electrolytic aluminum companies by about 20% in the first round, and the scale of production reduction is expected to be about 1.15 million tons. In September, the national electrolytic aluminum production was 3.577 million tons, a year-on-year increase of 5.3%, with an average daily output of 119,000 tons, a month-on-month increase of 3,000 tons, and a year-on-year increase of 6,000 tons; alumina production was 7.072 million tons, a year-on-year increase of 1.6%. The average output was 236,000 tons, an month-on-month increase of 8,000 tons and a year-on-year increase of 1,000 tons. The monthly average daily output of aluminum smelting products is shown in Figure 5.
Figure 5 Monthly average daily output of aluminum smelting products.
Third, domestic apparent aluminum consumption is lower than expected. We are currently in the off-season for aluminum consumption, and downstream demand performance is lower than expected. In September, in terms of aluminum processing, the operating rate of leading domestic aluminum downstream processing companies was 63.8%, a year-on-year decrease of 1.3%; in terms of real estate, real estate consumption is still weak, and recovery will still take time. In the first three quarters, the overall real estate market showed a continued downturn; in terms of automobiles, the national level introduced a series of policies to promote consumption, and various localities responded actively, and successively introduced measures such as issuing consumer coupons and car purchase subsidies, and automobile consumption increased steadily. In the first three quarters, the automobile industry market generally showed a trend of "not weak in the off-season and even more prosperous in the peak season".
Looking at the main areas of aluminum consumption, in terms of real estate, the national real estate development investment in September was 1.03692 billion yuan, a year-on-year decrease of 18.7%. The housing construction area of real estate development enterprises was 92.731 million square meters, a year-on-year decrease of 9.7%. The newly started housing area was 82.323 million square meters, a year-on-year decrease of 15.2%, and the completed housing area was 49.785 million square meters, a year-on-year increase of 24.3%; in terms of automobiles, automobile production and sales in September completed 2.85 million units and 2.858 million units respectively, an month-on-month increase of 10.7%, and a year-on-year increase of 6.6% and 9.5% respectively; the national aluminum alloy production in September was 1.261 million tons, a year-on-year increase of 11.3%; the national aluminum production in September was 5.550 million tons, a year-on-year increase of 5.7%.
Fourth, bauxite imports increased year-on-year and aluminum exports decreased year-on-year. Due to poor domestic bauxite endowment, aluminum resources remain a net import. In terms of bauxite imports, my country's bauxite imports have maintained an upward trend. In September, my country imported 10.024 million tons of aluminum ore and its concentrates, a year-on-year increase of 23.1%. Among them, 6.772 million tons were imported from Guinea, a year-on-year increase of 66.3%; 2.698 million tons were imported from Australia, a year-on-year decrease of 0.4%. In terms of aluminum materials, we will continue to maintain a development pattern of mainly domestic recycling and dual domestic and international recycling. In September, my country exported 436,000 tons of unwrought aluminum and aluminum products. A year-on-year decrease of 7.6%.
To sum up, on the premise that the national economy continues to recover steadily and develop, we expect that my country's aluminum smelting industry will continue to operate in the "normal" range in the future, and the prosperity index may rise.
P.S.:
1. The aluminum smelting industry boom leading composite index (referred to as: leading index) is used to determine the recent trends in the economic operation of the aluminum smelting industry. The index consists of the following five indicators: LME aluminum settlement price, M2, total fixed asset investment in aluminum smelting projects, commercial housing sales area, and power generation.
2. The consistent composite index of the aluminum smelting industry (referred to as: consistent index) reflects the current economic operating conditions of the aluminum smelting industry. The index consists of the following five indicators: electrolytic aluminum production, alumina production, operating income of aluminum smelting companies, total profits of aluminum smelting companies, and total aluminum exports.
3. The lagging composite index of the aluminum smelting industry (referred to as: lagging index) and the consistent index are mainly used to monitor the trend of economic changes and play a role in subsequent verification. The index consists of the following three indicators: the balance of working capital of aluminum smelting companies, the balance of accounts receivable of aluminum smelting companies, and the balance of finished product funds of aluminum smelting companies.
4. The comprehensive prosperity index reflects the current prosperity level of the aluminum smelting industry. The prosperity light map divides the economic operation status of the aluminum smelting industry into five levels. "Red light" indicates that the economy is overheating, "yellow light" indicates that the economy is on the hot side, "green light" indicates that the economy is operating normally, and "light blue light" indicates that the economy is tending towards cold, "blue light" means the economy is supecooling. Different weights are given to the individual indicator lights, and the comprehensive prosperity index compiled by them is also displayed by 5 light areas.
The comprehensive prosperity index consists of 10 indicators, namely the leading index and the consistent index.
5. All indicators used in compiling the index have been seasonally adjusted and seasonal factors have been eliminated.
6. The previous monthly prosperity index will be revised every month. When the latest month's data is added to the time series, the previous monthly prosperity index will change more or less. This is the result of automatic correction by the model.
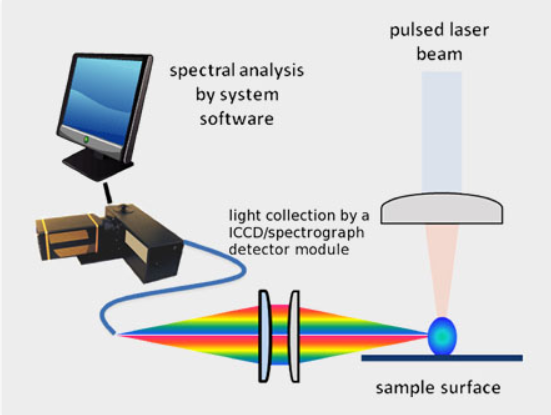
Laser induced breakdown spectroscopy is an elemental analysis technique with broad application in science and industry. It uses high energy, short pulse laser as the excitation source to achieve optical breakdown at material surface. Applicable to detect aluminum elements.
LIBS: Revolutionizing Aluminum Recycling for a Sustainable Future
Laser-Induced Breakdown Spectroscopy (LIBS)
Related Article