
An Exceptional View of Geological Materials with Raman Imaging
2024-01-16
Key Words :
Raman Imaging Microscope, Raman Imaging Software,Calcite, Carbonate Minerals, Dolomite, Geology, Limestone, Mineral Identifcation, Multivariate Curve Resolution (MCR), Quartz, Septarian Nodule
Introduction
There is a wealth of information that can be obtained from geological samples. Identifying which minerals are present is just part of a much more detailed story that these samples can tell. Rocks and minerals contain information key to understanding the conditions and environments under which they were formed. This information provides pieces of the puzzle that help geologists understand the history of the Earth and how this affects our current world. These studies are not only important for things like mineral and hydrocarbon exploration and extraction, but can also give insights into the prediction of natural disasters (earthquakes, foods, landslides, and volcanic activity), climatic changes and how this relates to the evolution of life, and locating and managing water resources. Understanding the past helps shape the present and foresee the future.
Raman spectroscopy is an established analytical technique for the analysis of geological samples. It not only provides a fast and effcient way of identifying specifc materials but also considerable information on molecular structure and chemical environments. Raman spectroscopy identifes structures and not just compositions. Ever expanding databases of Raman spectra aid in the positive identifcation of minerals. Beyond just identifcation, Raman spectroscopy can be used to evaluate various phases of the same or very similar chemical composition. Confocal Raman micro-spectros-copy can be used to characterize inclusions within samples without the need to expose the inclusions. Different solid, liquid, or gaseous phases within the inclusion can be studied this way. This type of analysis can also be useful for analyzing archived samples that have been mounted under glass cover slips. Raman spectroscopy can even be used to evaluate things like residual pressure and stress within a sample by looking at shifts in the Raman peaks. It is a quick and effcient analytical method that provides a wealth of information on a variety of different types of samples.
Single Point Raman vs. Raman Imaging
Raman micro-spectroscopy analyzes very small samples or sample domains, typically down to about 1 micron. Single-point Raman analysis is an excellent choice for the investigation of a specific location on a sample but it is limited in that it requires the user to select a point, usually based solely on a visual image or on a limited survey of the sample. In some cases this is a sufficient approach but is it not always easy to identify the important locations on the sample and it can take some time to find a specific region of interest. There is also the question of how representative that single position is of the rest of the sample. There are various ways of increasing the effective spot size to cover more of the sample but with that approach the spectrum becomes a convolution of many different components. While it still is possible to deconvolute this spectrum into the component contributions, all the spatial information is lost.
Raman imaging, however, provides a powerful alternative where large areas of the sample can be analyzed and still preserve the spatial information. Covering larger areas of the sample provides confidence that important areas are not being missed. The vast amounts of data generated by Raman imaging gives a more statistically relevant analysis of the sample.
Raman Imaging can Now be Routine
The Raman imaging data in this application note were acquired using a Raman imaging microscope and the Raman imaging software. This instrument collects Raman spectral data at astoundingly fast speeds. The increase in acquisition rate comes from synchronizing a highly sensitive EMCCD detector with a very fast and accurate microscope stage and tying it all together with software that can process vast amounts of data very quickly. This increase in speed means that the collection of large area Raman images is now not only practical but routine. This instrument represents an evolution of the DXR Raman product line while retaining the best qualities of the platform such as autoalignment/autocalibration and user exchangeable lasers, filters, and gratings. OMNICxi imaging software was specifically designed to provide an image-centric approach to analyzing samples. Data collection options include: quick surveys to locate areas for further investigation; real-time visual updates ensuring confident optimization of imaging parameters; and single, multiple, and auto-selected region collects, provide a variety of data collection options. The software provides powerful tools to easily process all the Raman spectroscopic data into informative Raman images.
Identifying Multiple Components in a Large Area
This application note covers just a few of the many ways Raman imaging can be utilized for the analysis of geological samples. A common use of Raman spectroscopy is the identification of different mineral components in a large area of a mineral sample. The sample used was a septarian nodule from Morocco which had a flat polished surface. A septarian nodule is a concretion or a round hard mass of sedimentary rock where angular cavities and cracks formed and were subsequently filled in by other minerals. These nodules are commonly composed of carbonate materials and known to contain a variety of minerals including: calcite, chert, flint, jasper, goethite, hematite, dolomite, ankerite, siderite, pyrite, marcasite, barite, and gypsum.
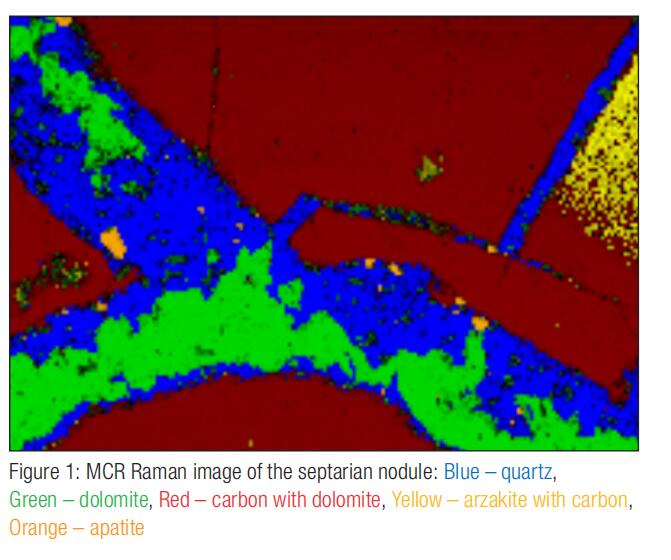
Figure 1 shows a Raman image collected from a portion of a septarian nodule using a 532 nm laser and a 10×objective. The Raman image is based on a multi-variate curve resolution, or MCR, analysis of the Raman data. The varying colors represent different components identified by the MCR analysis routine. This image represents a sample area of approximately 5.0 × 3.4 mm and 27,000 spectra. The image pixel size is 25 microns. The data was collected at a rate of 50 Hz or 0.02 seconds per spectrum, a relatively slow speed for this instrument, but necessary due to the low Raman signal from some of the components in the sample. Quartz and dolomite did not require this slow acquisition rate but the azkarite was much more difficult to identify when utilizing very fast collection speeds. 100 scans were used to improve the signal to noise of the spectra and it took 15 hours to collect this data.
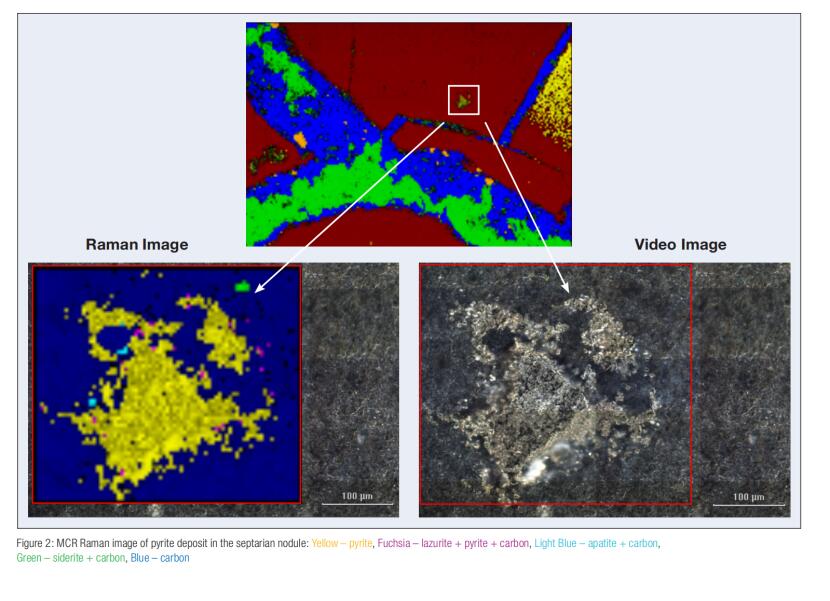
The image could be collected in less than an half an hour using an acquisition speed of 300 Hz and 10 scans but in that case some of the lower concentration and weaker Raman scattering components were difficult to identify. However, this may be sufficient depending on the goal of the analysis. There is always a trade-off between collection time and spectral quality and in this case the spectral quality was optimized. This still represents a vast improvement in collection time over simple point mapping. The five components shown in the Raman image are quartz, dolomite, carbon, arzakite, and apatite. One additional component was observed but was not independently identified by the MCR analysis as it was a very small fraction of the whole area and thus not a sufficient spectral variation. However it was still possible to identify a pyrite deposit. Figure 2 shows a new Raman image of a smaller region of the sample. This image is approximately 385 × 340 microns and contains 5236 spectra. The image pixel size is 5 microns. A 50× objective was used for the video mosaic and for collecting the Raman imaging data. The acquisition rate and number of scans were the same as the previous image but the collection time was just 3 hours because the fewer number of spectra. When the MCR analysis routine was applied to this region, the pyrite was clearly identified along with two new materials, lazurite and siderite, thus illustrating how increasing spatial resolution can define additional details.
Identifying and Differentiating Carbonate Minerals
The next example is a thin slice of an algal limestone from the Strimbes Formation in Greece.1 Evaluating the presence or absence of different carbonate minerals provides considerable details on the formation environment. For instance, carbonate minerals can be used as paleoclimate and paleoenvironmental indicators. The relative amounts of different carbonate minerals can vary with the environmental conditions under which they were formed. Understanding the cemetation processes in limestones can also be important in petroleum exploration.
Distinguishing between different types of carbonate minerals is not always easy. Chemically they can have very similar or even the same composition. Dolomite (CaMg(CO3)2) can be distinguished from calcite (CaCO3) using Raman spectroscopy. The carbonate peak in calcite at 1086 cm-1 is shifted to 1099 cm-1 in dolomite. It is even possible to differentiate different crystalline forms of calcium carbonate such as calcite and aragonite. The carbonate peak in the Raman spectrum of calcite at 712 cm-1 is shifted to 704 cm-1 in aragonite. This illustrates the utility of Raman spectroscopy to differentiate between very similar materials and even polymorphs of the same chemical composition.
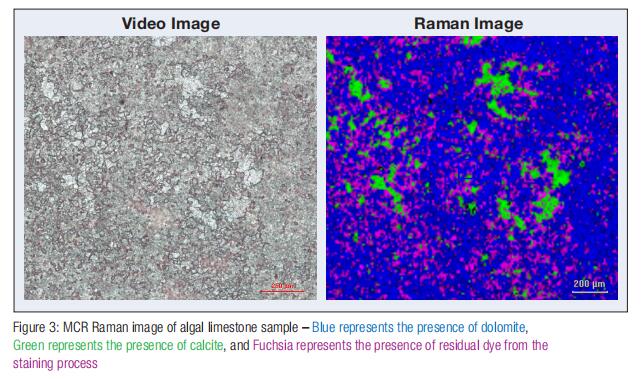
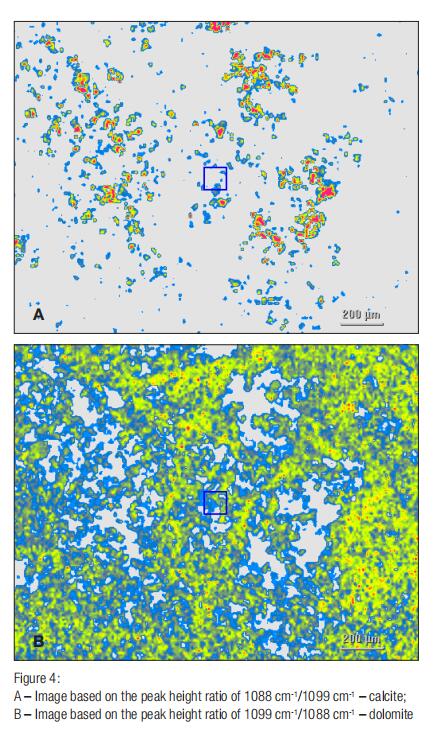
Figure 3 shows the video and Raman image of a portion of the algal limestone sample. This was a thin, polished, sample mounted on a glass slide. The Raman image is the result of an MCR analysis of the Raman data and the colors represent different components in the sample. In this case, blue indicates dolomite, green indicates calcite, and fuchsia indicates the presence of what appears to be an organic dye. The sample had been previously subjected to a staining procedure, intended to visibly highlight the calcite in preference to the dolomite. This is a visible way to distinguish between these carbonate materials but also results in damage and contamination of the sample. This image was collected with a 455 nm laser because this laser wavelength minimized the fluorescence observed when using a 532 nm laser; a prime example where a shorter wavelength laser actually showed less fluorescence than the longer wavelength laser. Some of the fluorescence might have been a result of the residual dye that was present on the sample. The Raman and video images were collected using a 10× objective. The image regions represent a 2.0 × 1.5 mm area on the sample. The Raman image consists of 30,000 spectra with a pixel size of 10 microns. The data was collected at a rate of 300 Hz (3.3 ms per spectrum) and using 25 scans, taking approximately 1 hour. Figure 4 shows two Raman images based on ratios of peak heights (1099 cm-1 and 1086 cm-1), showing the distribution of calcite and dolomite. Interestingly, in the visible image, Figure 3, it is possible to see regions of coarse and fine grains in the sample and these areas are shown by the Raman image analysis to correspond to calcite and dolomite respectively. There was no evidence for any aragonite (peak at 704 cm-1) in the sample. Raman imaging is clearly a quick and efficient method for determining the presence and distribution of the various carbonate materials without being destructive or contaminating the sample.
Characterizing Another Type of Limestone1
A visual image of a second type of limestone is shown in Figure 5 along with a Raman image generated from an MCR analysis of the Raman spectra. It is interesting to see the differences in prominent features in these two images. A 455 nm laser was used as the excitation source and a 10× objective was used for collecting both the visual mosaic and the Raman chemical image. This image represents an area on the sample approximately 3.4 × 2.6 mm, consisting of 23,000 spectra with a pixel size of 20 microns. An acquisition rate of 50 Hz (0.02 seconds per spectrum) was used along with 50 averaged scans to obtain spectra with good signal to noise. The collection time for the whole image was approximately 7 hours.
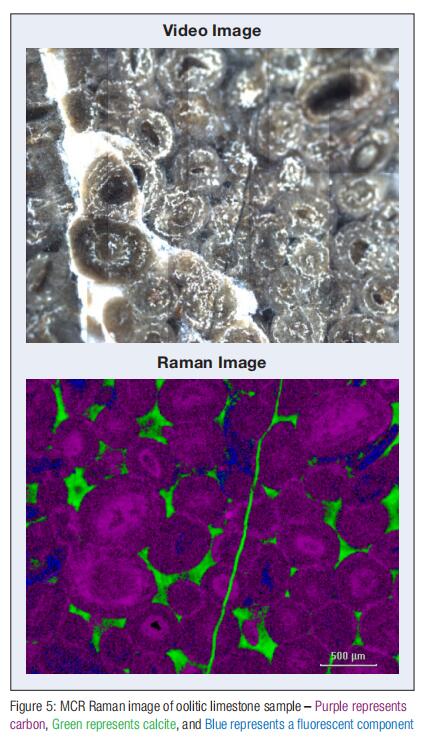 The purple area in the Raman image, determined from the MCR routine, is primarily carbon with a small contribution from calcite. The Raman spectra of the carbon rich areas are consistent with poorly crystalline graphite. This component clearly defines the ooids, or spherical grains, observed in the sample. The green areas are almost entirely calcite and it is the interstitial carbonate cement that is holding the ooids together. The blue areas represent calcite rich regions but there is also a fluorescent component present in these areas. It is possible to see some of the concentric layers in the ooids with this image but these can be better seen with a Raman image based on the height of the carbon peak at 1608 cm-1 shown in Figure 6A. The range of colors indicates the intensity of carbon peaks, with the darker shades representing the higher intensity peaks. It is interesting to note that some of the cores of the ooids are carbon rich and some are carbon poor. The image shown in Figure 6B is based on the peak height of the carbonate peak in calcite (1088 cm-1). The higher intensity of the calcite carbonate peak, the darker the color in the image. This image gives a good view of the distribution of calcite in the sample but shows less detail in terms of the concentric nature of the ooids.
 Conclusion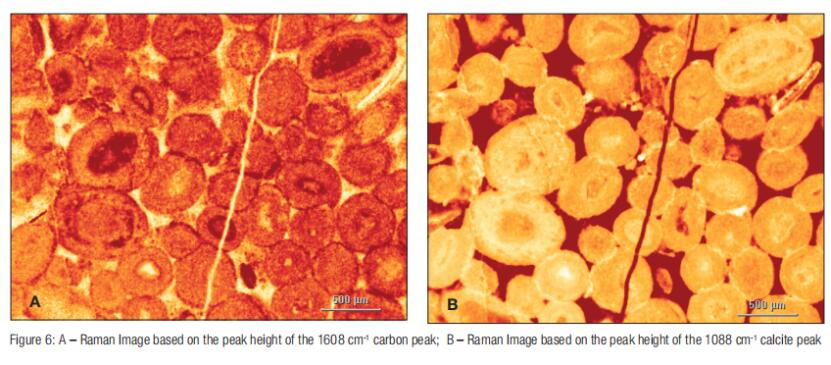
These are just a couple of examples of the wide variety of geological samples that can be analyzed using Raman imaging. Raman spectroscopy is clear choice as a tool for analyzing geological samples. It not only provides an excellent way of identifying various mineral components but it also provides detailed structural information. Raman spectroscopy can be used for applications ranging from determining residual stress in samples to the in situ analysis of inclusions. It can be used to extract information on the formation and history of geological samples. It is a non-destructive method providing sampling options that are not available with other analytical methods. It is fast and requires essentially no sample preparation. Raman imaging takes all of these wonderful advantages of Raman spectroscopy and extends them into a new dimension. It is now practical to routinely image and analyze large areas of samples rather than being relegated to a much smaller area or even a single point. By elevating the capabilities of Raman analysis to whole new level, there is immense potential for numerous geological applications. The easy-to-use Raman imaging microscope and software provide a powerful, research-grade platform to explore these multifaceted pieces of history.
Application of ATR7010 Raman Spectrometer in Edible Oil Adulteration and Origin Identification
Raman Spectroscopy for Geological Materials Analysis
Related Article

Discover the Optosky ATR1600 ultra-micro Raman spectrometer—a 210g pocket-sized device for on-site, non-destructive gemstone identification. With a 20,000+ substance spectral library, dedicated jewelry edition, Bluetooth smartphone APP, and PDF reporting, it enables rapid screening of natural, synthetic, and treated gemstones at exhibitions, pawnshops, and markets.
ATR1600: The 210g Pocket Raman Gem Identifier
Explore how micro-confocal Raman spectroscopy, combined with SERS, enables rapid, non-destructive, molecular-level screening of veterinary drug residues such as malachite green, enrofloxacin, and chloramphenicol in aquatic products. Learn how Optosky’s ATR8100 supports microscopic localization, multi-wavelength excitation, mapping imaging, and portable on-site testing—while clarifying its role alongside LC-MS/MS confirmation.
Applications | Micro-Raman Drug Residue Screening in Seafood
Discover how Raman spectroscopy enables label‑free cancer diagnosis by reading molecular fingerprints of cells. From key Raman peaks and AI‑powered classification to the ATR8800 confocal platform, this article explores the frontiers, challenges, and clinical potential of Raman‑based cancer detection.
How Raman Spectroscopy Sees Through Cancer Cells: Label‑Free Cancer Diagnosis
Optosky successfully delivered and commissioned multiple ATP9100 field spectroradiometers at a university in Northwest China. The project included installation, performance verification, and on‑site training – supporting agricultural remote sensing, ecological monitoring, and geological surveys while building a standardized spectral research platform.
Case Study | ATP9100 Acceptance at Northwest University