
Flame atomic absorption spectroscopy for water monitoring
2024-01-24
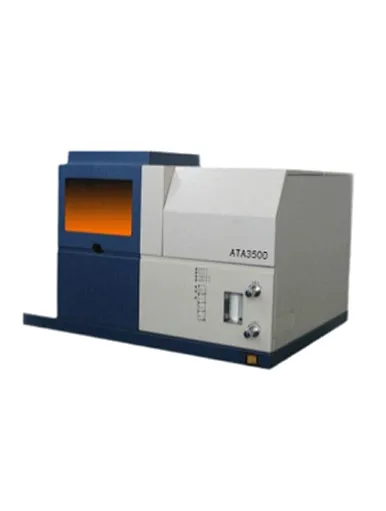
There are several techniques for measuring minerals in water, one of the simplest, cheapest, and fastest is flame atomic absorption (AA) spectroscopy. Therefore, despite the increasing popularity of ICP-OES and ICP-MS, this technique continues to be widely used. This work focuses on the determination of seven non-toxic elements commonly found in drinking water using the Optosky flame atomic absorption spectrometer.
Samples included locally collected municipal and well water, spring water purchased from a local grocery store, and certified drinking water standards (Trace Metals in Drinking Water-High Purity Standards™, Charleston, SC, USA). Sample preparation consisted only of acidifying each water with 1% HNO3 (v/v) and adding 0.1% lanthanum chloride as a release reagent for calcium (Ca) and magnesium (Mg) and as an ionization inhibitor for sodium (Na) and potassium (K). All analyzes were performed using a flame atomic absorption spectrometer using the conditions in Tables 1 and 2. Due to the high mineral content, the burner was rotated 30 degrees to reduce the signal intensity for mineral analysis. Additionally, K and Na are analyzed in emission mode, which enables flame atomic absorption spectrometer to be automatically configured to extend the analytical range, allowing higher concentrations to be measured. Samples are self-aspiration using a high-sensitivity nebulizer, which is standard on flame atomic absorption spectrometer. Copper (Cu), iron (Fe), and zinc (Zn) were determined using a nebulizer without a spacer (providing maximum sensitivity). Insert spacers for determination of Na, K, Mg and Ca.
|
Parameter
|
Value
|
|
Air Flow (L/min)
|
2.5
|
|
Acetylene Flow (L/min)
|
10
|
|
Read Time (sec)
|
3
|
|
Replicates
|
3
|
Table 1
|
Element
|
Wavelength (nm)
|
Slit (nm)
|
Mode
|
Burner Angle (degrees)
|
Calibration standards (mg/L)
|
Calibration Curve
|
|
Ca
|
422.67
|
0.7
|
Absorption
|
30
|
0.5, 1.0, 2.0, 5.0, 10, 20, 40
|
Non-linear through zero
|
|
Cu
|
324.75
|
0.7
|
Absorption
|
0
|
0.05, 0.10, 0.25, 0.50
|
Linear through zero
|
|
Fe
|
248.33
|
0.2
|
Absorption
|
0
|
0.05, 0.10, 0.25, 0.50, 1.0
|
Linear through zero
|
|
Mg
|
285.21
|
0.7
|
Absorption
|
30
|
0.5, 1.0, 2.0, 5.0, 10
|
Non-linear through zero
|
|
K
|
766.49
|
0.7
|
Emission
|
30
|
2.5, 10, 20, 30, 40, 50
|
Non-linear through zero
|
|
Na
|
589.00
|
0.2
|
Emission
|
30
|
2.5, 10, 20, 30, 40, 50
|
Non-linear through zero
|
|
Zn
|
213.86
|
0.7
|
Absorption
|
0
|
0.05, 0.10, 0.25, 0.50
|
Linear through zero
|
Table 2
Results and Discussion
All calibrations produced correlation coefficients of 0.999 or higher. The accuracy of the calibration was assessed using an independent calibration verification (ICV) solution that was diluted 100-fold to fall within the calibration curve range. The ICV results are shown in Table 3, demonstrating the accuracy of the calibration curve.
|
Element
|
Concentration (mg/L)
|
Experimental (mg/L)
|
% Recovery
|
|
Ca
|
5.00
|
4.86
|
97
|
|
Cu
|
0.25
|
0.26
|
104
|
|
Fe
|
1.00
|
1.00
|
100
|
|
Mg
|
5.00
|
4.88
|
98
|
|
K
|
5.00
|
4.78
|
96
|
|
Na
|
5.00
|
5.12
|
102
|
|
Zn
|
0.20
|
0.21
|
105
|
Table 3
To validate the method, reference materials were first analyzed and the results are shown in Table 4 . All recoveries were within 10% of the standard values, demonstrating the accuracy of the method.
|
Element
|
Experimental (mg/L)
|
Certified (mg/L)
|
% Recovery
|
|
Ca
|
33.4
|
35.0
|
95
|
|
Cu
|
0.022
|
0.020
|
110
|
|
Fe
|
0.095
|
0.100
|
95
|
|
Mg
|
8.69
|
9.00
|
97
|
|
K
|
2.28
|
2.50
|
91
|
|
Na
|
5.90
|
6.0
|
98
|
|
Zn
|
0.070
|
0.070
|
100
|
Table 4
Based on the accuracy of the established method, multiple drinking water samples from different sources were analyzed. Municipal and well water samples were collected directly from taps, while spring water samples were poured from purchased bottles. The results are shown in Table 5.
|
Element
|
Municipal Water (mg/L)
|
Well Water-1 (mg/L)
|
Well Water-2 (mg/L)
|
Well Water-3 (mg/L)
|
Spring Water-1 (mg/L)
|
Spring Water-2 (mg/L)
|
|
Ca
|
17.7
|
0.148
|
35.3
|
32.4
|
3.43
|
19.2
|
|
Cu
|
0.048
|
|
0.052
|
0.017
|
|
|
|
Fe
|
|
|
0.019
|
|
|
|
|
Mg
|
6.43
|
0.026
|
4.90
|
5.12
|
0.799
|
6.09
|
|
K
|
<0
|
233*
|
4.89
|
4.10
|
0.73
|
0.69
|
|
Na
|
38.4
|
3.63
|
10.9
|
42.9
|
6.60
|
7.25
|
|
Zn
|
0.008
|
0.043
|
0.010
|
0.023
|
|
|
Table 5
The presence of copper and zinc in the four samples collected from the faucets is most likely due to leaching of copper pipes, fittings and solder. Well Water-1 is interesting because it has the lowest content of all the samples, except for the very high levels of K. Further investigation determined that the home had a water softener installed that utilized K as a counterion to remove high levels of Ca and Magnesium from the well water. As expected, copper and zinc were not detected in the spring water; only the minerals were present. Variations in mineral concentrations indicate the different geology of these water source areas.
This work demonstrates the ability of flame atomic absorption spectrometer to successfully measure mineral elements in drinking water samples, including municipal, well, and spring water. Trace and mineral elements can be measured by utilizing the ability to rotate the burner and measure in emission mode.
Portable XRF spectrometer
VOCs are the main culprits of air pollution
Related Article

This application utilizes near-infrared full-spectrum technology to quickly and nondestructively determine fruit sugar content (Brix value), replacing traditional destructive testing methods.
Overview | NY2000pro Portable Non-Destructive Brix Meter
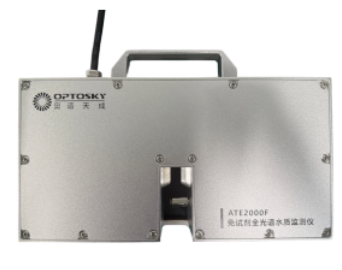
Optosky’s ATE2000 series is a versatile reagent-free full-spectrum water quality monitor, acting as an "all-rounder" in water quality monitoring. Based on ultraviolet-visible full-spectrum technology, it offers core advantages of reagent-free, full-spectrum, multi-parameter, and in-situ monitoring, real-time detecting over 10 parameters like COD and ammonia nitrogen
ATE2000: The "all-rounder" of water quality monitoring.
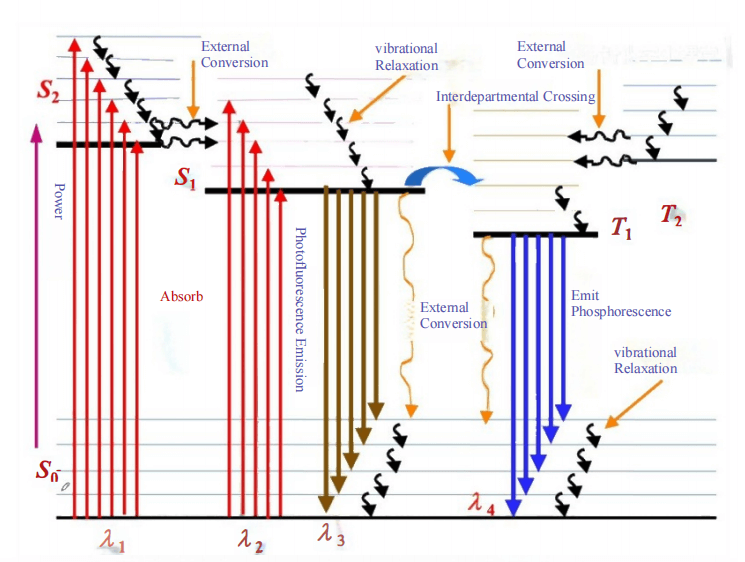
This article explains the basics of fluorescence and key analysis techniques used to detect molecules and study reactions in fields like biology and chemistry. Ideal for those seeking a quick overview of fluorescence principles and applications.
Fluorescence Principles and Analysis Techniques

This article explores the use of Tunable Diode Laser Absorption Spectroscopy (TDLAS) technology for detecting gas leaks in underground pipelines. TDLAS is a highly sensitive and precise method that enables real-time monitoring of combustible gases, ensuring early detection of leaks and enhancing the safety of pipeline networks. The technology offers a reliable solution for industries looking to prevent potential hazards and optimize gas leak management.
Solution: Detecting Gas Leaks in Pipelines with TDLAS Technology