
Microscopic Raman Spectroscopy for Graphene Sample Testing
author: Claire Du
2023-03-15
Tested using a Raman microscope excited by a 532nm laser:
Samples should be placed on slides with aluminum foil.
Spray drying graphene
1. After focusing the sample with a 20X objective lens, as shown below:
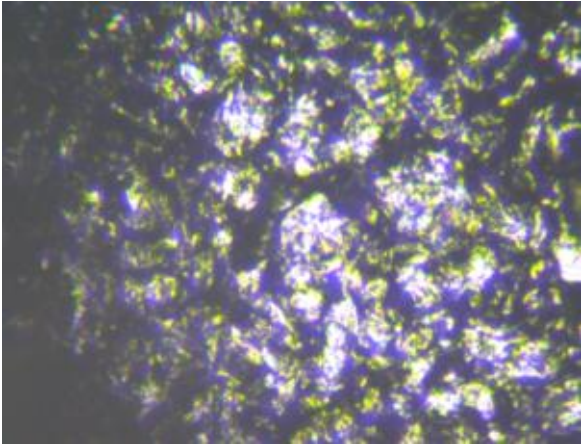
2. Need to move the stage down 15 times, 100um each time (reference)
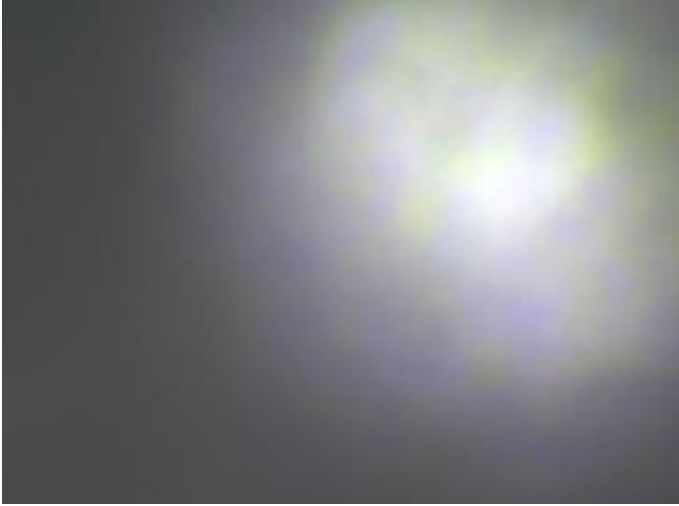
3. Acquisition parameters: integration time 20s, laser power 30mw, use 1 baseline correction
The test results are as follows
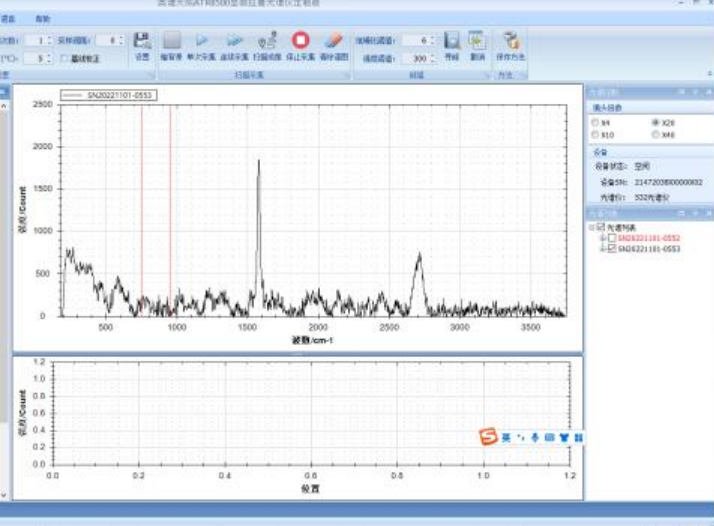
carbon nanotubes
1. After focusing the sample with a 20X objective lens, as shown below:
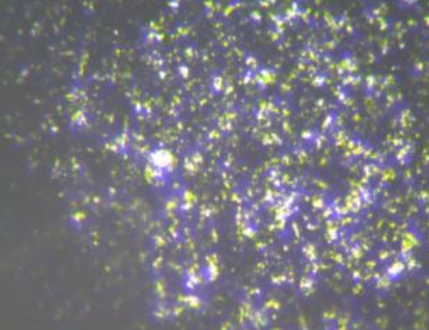
2. The stage needs to be moved down 17 times, each movement is 200um (for reference)

3. Acquisition parameters: integration time 20s, laser power 50mw, use 1 baseline correction
The test results are as follows:
The test results are as follows:
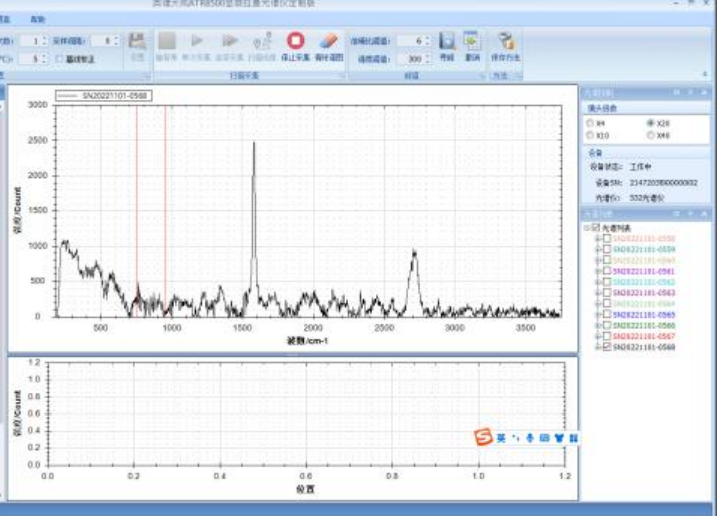
Microwave reduction of graphene
1. The camera cannot image, and can only show the smallest light spot through the LED light source of the camera, that is, the focus state, and the sample must be flattened
2. Need to move the stage up 12 times, 100um each time (for reference)
3. Acquisition parameters: integration time 20s, laser power 30mw, use 1 baseline correction
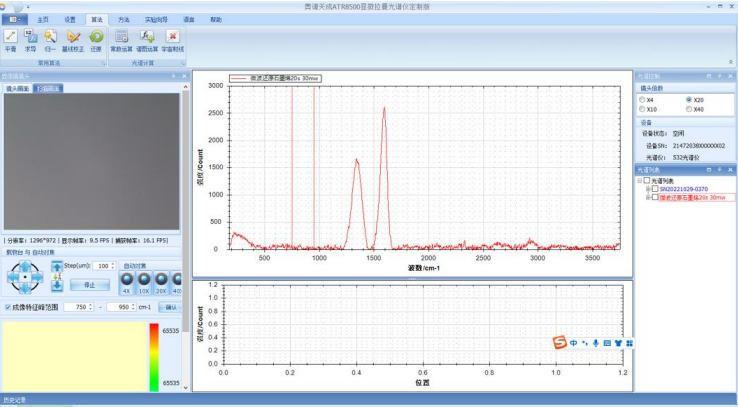
Graphene
1. Imaging cannot be made through the observation camera, but only when the smallest light spot is displayed through the LED light source of the camera, that is, the focus state, and the sample must be flattened
2. Need to move the stage up 12 times, 100um each time (for reference)
3. Acquisition parameters: integration time 20s, laser power 20mw, use 1 baseline correction
2. Need to move the stage up 12 times, 100um each time (for reference)
3. Acquisition parameters: integration time 20s, laser power 20mw, use 1 baseline correction
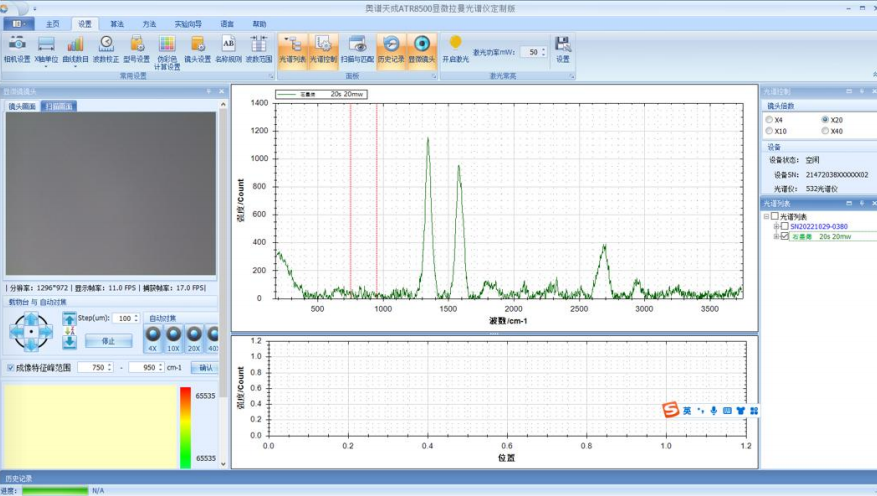
※Remarks - the Raman signal strength that affects the test:
1. Sample state (moisture content)
2. Focused focus
3. Flatness of sample surface
4. Sample purity
1. Sample state (moisture content)
2. Focused focus
3. Flatness of sample surface
4. Sample purity
ATR1600: The 210g Pocket Raman Gem Identifier
Related Article

Discover the Optosky ATR1600 ultra-micro Raman spectrometer—a 210g pocket-sized device for on-site, non-destructive gemstone identification. With a 20,000+ substance spectral library, dedicated jewelry edition, Bluetooth smartphone APP, and PDF reporting, it enables rapid screening of natural, synthetic, and treated gemstones at exhibitions, pawnshops, and markets.
ATR1600: The 210g Pocket Raman Gem Identifier
Explore how micro-confocal Raman spectroscopy, combined with SERS, enables rapid, non-destructive, molecular-level screening of veterinary drug residues such as malachite green, enrofloxacin, and chloramphenicol in aquatic products. Learn how Optosky’s ATR8100 supports microscopic localization, multi-wavelength excitation, mapping imaging, and portable on-site testing—while clarifying its role alongside LC-MS/MS confirmation.
Applications | Micro-Raman Drug Residue Screening in Seafood
Discover how Raman spectroscopy enables label‑free cancer diagnosis by reading molecular fingerprints of cells. From key Raman peaks and AI‑powered classification to the ATR8800 confocal platform, this article explores the frontiers, challenges, and clinical potential of Raman‑based cancer detection.
How Raman Spectroscopy Sees Through Cancer Cells: Label‑Free Cancer Diagnosis
Optosky successfully delivered and commissioned multiple ATP9100 field spectroradiometers at a university in Northwest China. The project included installation, performance verification, and on‑site training – supporting agricultural remote sensing, ecological monitoring, and geological surveys while building a standardized spectral research platform.
Case Study | ATP9100 Acceptance at Northwest University