
Reseach on Classification of Pinus Massoniana Pests Based on Hyperspectral Data
author: Gavin
2022-01-06
The occurrence of plant diseases and insect pests in my country’s forests, crops, lawns, etc. brings huge economic losses every year, with losses exceeding several billion yuan, hindering the development of my country’s forest industry, agriculture, animal husbandry, etc., and giving back to the natural environment. The protection caused terrible damage. According to the official website of the State Forestry Administration HL, pine wood nematode diseases and insect pests spread all over the country, spreading to a wide range. Some masson pine or even the entire plant died. Because of its strong contagiousness, it infects the surrounding healthy masson pine, causing major economic problems. And ecological loss.
Principle
Based on hyperspectral remote sensing data (including ground data and spaceborne hyperspectral data), Masson pine is used as the research object to achieve the purpose of classification of diseases and insect pests, and expand the spectral response of different levels of diseases and insect pests at the leaf scale of Masson pine needle and canopy scale to a large range. The pixel scale is expanded from point to surface to realize the detection and identification of masson pine targets of different levels of pests and diseases. The main purpose of the research is to base on the ground non-imaging spectral data, and the space-borne hyperspectral imaging data is aimed at horsetail. Pine achieves fine classification of pests and diseases, and conducts research on related models and algorithms.
Solution
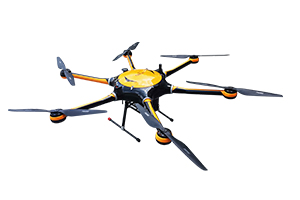
Spectral collection uses Optosky ATH9010-4-25, ATH9010-4-25 spectral range is 400-1000.It consists of eight main parts of six-rotor UAV, high-stable cloud platform, hyperspectral imager, big memory storage, GPS navigation system, ground receiver station, and ground control system.
Principle
Based on hyperspectral remote sensing data (including ground data and spaceborne hyperspectral data), Masson pine is used as the research object to achieve the purpose of classification of diseases and insect pests, and expand the spectral response of different levels of diseases and insect pests at the leaf scale of Masson pine needle and canopy scale to a large range. The pixel scale is expanded from point to surface to realize the detection and identification of masson pine targets of different levels of pests and diseases. The main purpose of the research is to base on the ground non-imaging spectral data, and the space-borne hyperspectral imaging data is aimed at horsetail. Pine achieves fine classification of pests and diseases, and conducts research on related models and algorithms.
Solution
Spectral collection uses Optosky ATH9010-4-25, ATH9010-4-25 spectral range is 400-1000.It consists of eight main parts of six-rotor UAV, high-stable cloud platform, hyperspectral imager, big memory storage, GPS navigation system, ground receiver station, and ground control system.
- Use the chlorophyll content to classify the disease, and carry out the correlation analysis of the masson pine canopy spectral reflectance with different disease indexes. Collect ground spectrum data with different severity of masson pine diseases and insect pests, and carry out data preprocessing, sensitive band selection, correlation analysis and other methods to analyze the relationship between the target masson pine spectral characteristic curves with different damage levels of pests and diseases, and screen out the sensitivity to disease index And the characteristic band that can be combined.
- Correlation analysis and research between the disease index and the red edge characteristic parameters calculated by the screening. Combining the aforementioned research and analysis, the optimal bands for identification are screened and calculated in sequence, and the relationship between the selected red border parameters and the vegetation index and the disease and insect pests of each level of the masson pine is studied, and the relevant characteristics are studied. And conduct analysis to explore the selection of independent variables for constructing the inversion model.
- Research on the inversion model of the canopy spectral reflectance characteristics and disease level of masson pine diseases and insect pests. Based on the spectrum data and disease index data of masson pine diseases and insect pests of different severity, the inversion model of disease and pest severity is established. Based on this, the grade spectrum seat of different disease and pest severity is established, and the research provides basic verification data for pixel-scale pest monitoring.
- Research on classification of inversion results of disease and pest disease index. According to the constructed disease and insect pest severity inversion model, the corresponding disease index classification research, including fuzzy classification and cluster analysis, explores the classification methods of different grades of spectral blocks, so as to provide auxiliary analysis data for the research.
Conclusion
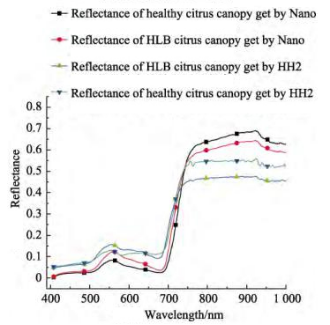
The original spectral data is high-resolution spectral data, with the number of bands ranging from 350 to 2500 mn, and the narrow band at the nanometer level and the number of bands are large and continuous. The most obvious characteristics of these two hyperspectral data can be used to predict masson pine data of different pest levels. Analyze and find out the spectral response relationship between masson pine's reflectance and various disease and pest severity levels that can more sensitively reflect the masson pine suffering from pests and diseases. Through the analysis, the accuracy and scientificity of the selected sensitive bands and vegetation index can be improved.
Related products
Classification of vegetation diseases and insect pests based on hyperspectral remote sensing data
FieldSpec Spectroradiometer:ATP9110-25
Hyperspectral Camera:ATH1010-4-25
Airborne Hyperspectral Remote Sensing System:ATH9010
Drone Hyperspectral Imaging System:ATHL9010
Related articles
(1)Wang G , Zhang Y , He B , et al. A Framework of Target Detection in Hyperspectral Imagery Based on Blind Source Extraction]J]. IEEE Journal of Selected Topics in Applied Earth Observations and Remote Sensing, 2016, 9(2):835-844.
(2)Meganem I, Deville Y, Hosseini S , et al. Linear-Quadratic Blind Source Separation Using NMF to Unmix Urban Hyperspectral Images [J]. IEEE Transactions on Signal Processing, 2014, 62(7):1822-1833.
(3)Joria P. E.,Ahearn S.C.A Comparison of the SPOT and Landsat Thematic Mapper Satellite System fbr Detecting Gypsy Moth Defoliation in Michigan[J]. Photogram metric Engineering & Remote Sensing,1991,57(12): 1605-1608.
The original spectral data is high-resolution spectral data, with the number of bands ranging from 350 to 2500 mn, and the narrow band at the nanometer level and the number of bands are large and continuous. The most obvious characteristics of these two hyperspectral data can be used to predict masson pine data of different pest levels. Analyze and find out the spectral response relationship between masson pine's reflectance and various disease and pest severity levels that can more sensitively reflect the masson pine suffering from pests and diseases. Through the analysis, the accuracy and scientificity of the selected sensitive bands and vegetation index can be improved.
Related products
Classification of vegetation diseases and insect pests based on hyperspectral remote sensing data
FieldSpec Spectroradiometer:ATP9110-25
Hyperspectral Camera:ATH1010-4-25
Airborne Hyperspectral Remote Sensing System:ATH9010
Drone Hyperspectral Imaging System:ATHL9010
Related articles
(1)Wang G , Zhang Y , He B , et al. A Framework of Target Detection in Hyperspectral Imagery Based on Blind Source Extraction]J]. IEEE Journal of Selected Topics in Applied Earth Observations and Remote Sensing, 2016, 9(2):835-844.
(2)Meganem I, Deville Y, Hosseini S , et al. Linear-Quadratic Blind Source Separation Using NMF to Unmix Urban Hyperspectral Images [J]. IEEE Transactions on Signal Processing, 2014, 62(7):1822-1833.
(3)Joria P. E.,Ahearn S.C.A Comparison of the SPOT and Landsat Thematic Mapper Satellite System fbr Detecting Gypsy Moth Defoliation in Michigan[J]. Photogram metric Engineering & Remote Sensing,1991,57(12): 1605-1608.
Research on low-contrast wounded target search technology based on hyperspectrum
Recognition and Classification of Maize Drought on UAV Hyperspectral Images
Related Article

Discover Optosky’s air–ground collaborative hyperspectral solution for mine ecological restoration monitoring. Combining UAV hyperspectral imaging, fixed-point rotating-scan systems, and field spectroradiometers, it supports vegetation, soil, mineral alteration, and water environment monitoring for green mine evaluation and restoration acceptance.
Applications | Hyperspectral Mine Restoration Monitoring
Compare single InGaAs and CMOS+InGaAs detector architectures in hyperspectral imaging. Learn why both can cover 400–1700 nm, how visible-light-extended InGaAs works, and the trade-offs in calibration, spectral registration, and system integration for applications in agriculture, food safety, and industrial inspection.
Technology | Single InGaAs vs. CMOS+InGaAs in Hyperspectral Imaging
Discover how hyperspectral imaging combined with multi-feature fusion (PCA + 2DCOS + CARS) enables non-destructive three-level grading of chili pepper sunburn with 97.2% accuracy. Learn about the ATH3000 system and Optosky's customized solutions for horticultural crop quality inspection and damage classification.
Can Sunburned Chili Peppers Be Non-Destructively Graded? Hyperspectral Imaging ATH3000 Offers a New Answer
Discover the Optosky ATH9600 multi-lens UAV-borne multispectral imaging system—featuring 67° ultra-wide FOV, synchronous snapshot, 3.75 μm large pixel, and native DJI X-Port integration. Ideal for large-area farmland monitoring, orchard management, pest early warning, water quality inversion, and complex crop classification. Born for efficient, all-weather low-altitude remote sensing.
Born for Large-Area Remote Sensing! Optosky Releases the ATH9600 Multi-Lens UAV-Borne Multispectral Imaging System