Solution|Application of Fiber Optic Spectrometers in Color Measurement
Solution|Application of Fiber Optic Spectrometers in Color Measurement
Introduction: Why Do Objects Have Colors?
Under the energy provided by a light source (such as sunlight), electrons in the atoms of a substance undergo transitions from a ground state to an excited state, and then return from the excited state back to the ground state. This selective absorption or emission of specific wavelengths of light by the substance results in the display of its unique color.
For example, most metals appear silvery-white because the upper energy bands of metals have many vacant orbitals, and the energy difference between adjacent orbitals is very small. Therefore, when photons of any wavelength hit the surface of the metal, the free electrons inside the metal are excited to the vacant orbitals in the upper energy band. However, these electrons quickly return to lower energy states, emitting photons (with some photon energy converting to heat). Since the reflected light generally contains all visible wavelengths, most metals appear silvery-white. However, some metals are exceptions, such as pure gold appearing yellow and pure copper appearing reddish. The primary reason is that the outer d-electrons of metal ions in their crystals absorb short wavelengths like blue and violet light, causing transitions to vacant s-bands. As a result, the reflected light from their surfaces lacks blue and violet components, leading to different shades of yellow and red.
Spectral Color Measurement Technology
Traditional color measurement methods rely on direct observation by the human eye, which can perceive wavelengths between 380 nm and 780 nm. While this method is simple and flexible, it is highly influenced by personnel and environmental factors, making the results inaccurate and subjective. To objectively measure the color of objects, the International Commission on Illumination (CIE) established the standard colorimetric system, known as the CIE1931 system. This system uses the tristimulus values XYZ to quantitatively describe color, laying the foundation for accurate color measurement.
As previously mentioned, when a light source illuminates an object, the object selectively reflects or absorbs parts of the spectrum. Spectral color measurement takes advantage of this by using a spectrometer to obtain the relative spectrum of the light source S(λ), the transmittance spectrum T(λ) of the object, and the reflectance spectrum R(λ) of the object. This process determines the color stimulus φ(λ) of the object being measured. Then, by applying the colorimetric formula for tristimulus values, the tristimulus values X, Y, Z of the object’s color can be calculated, allowing the color of the object to be determined.
The formula for the tristimulus values is:
X = ∫x(λ)φ(λ)dλ,
Y = ∫y(λ)φ(λ)dλ,
Z = ∫z(λ)φ(λ)dλ
x(λ), y(λ), and z(λ) are the three color matching functions in the CIE standard colorimetric system. φ(λ) represents the color stimulus function: for self-luminous objects, φ(λ) = S(λ), where S(λ) is the relative spectral distribution of the light source; for transmissive objects, φ(λ) = T(λ)S(λ), where T(λ) is the spectral transmittance of the object being measured; for reflective objects, φ(λ) = R(λ)S(λ), where R(λ) is the spectral reflectance of the object being measured.
Application Example: Measuring Different Colored Paper with ATP2400
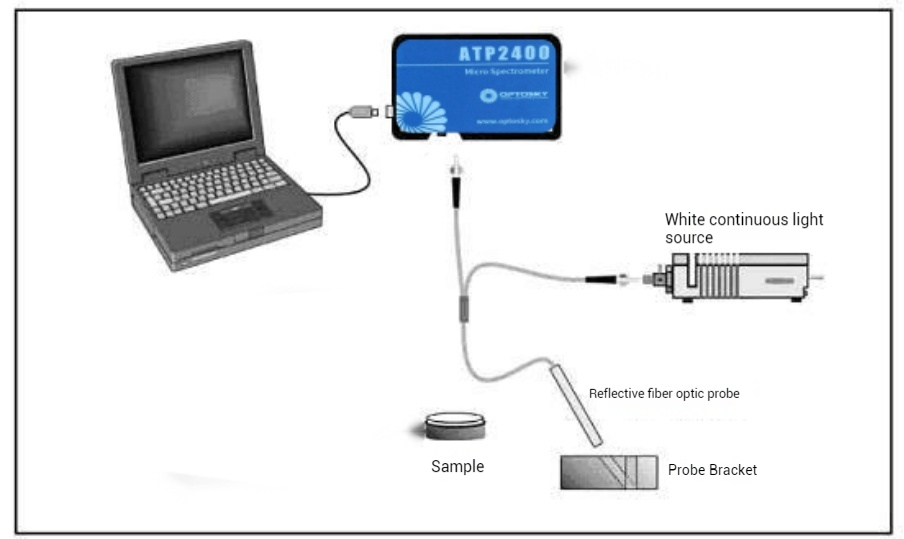
In this measurement, we use the ATP2400 fiber optic spectrometer, which operates in the 200 to 1100nm wavelength range with a resolution (FWHM) of 3nm. As shown in the image: a Y-type fiber connects the continuous white light source to the ATP2400 fiber optic spectrometer. The other end connects to the reflective fiber probe. Additionally, the ATP2400 is connected to a computer, and the testing software is launched.
Testing Method Procedure
- Turn off the light source and cover the probe to collect the dark background under darkroom conditions.
- Turn on the light source, and based on the blank intensity, set the spectrometer's integration time to 2500 ms and the number of scans to 1.
- Change the probe position and test different colored paper to obtain their respective spectral information.
Test Results and Analysis
As shown in the figure, the spectral information for different colors reveals the following:
- Each color exhibits a characteristic feature at 600-610nm, 760-780nm, and 900nm.
- The black spectrum has the lowest baseline intensity, while the white and pink spectra show the highest intensity.
- White, pink, and gray exhibit a characteristic peak at 480nm, whereas yellow, orange, green, and red show a characteristic peak in the 500-510nm range.
Product Recommendation | Grating Spectrometer ATP7330
Product Recommendation | ATP7810 IR Grating Spectrometer
Related Article