
Mineral Exploration: Spectroscopic Analysis Facilitates Malachite Content Detection
2025-06-09

Accurately determining ore composition is crucial for developing beneficiation processes and optimizing operations in mineral exploration and processing.While laboratory chemical methods can precisely measure the content of various minerals and the grade of valuable components, these techniques are cumbersome, complex, time-consuming, and require specialized knowledge and skills.
Additionally, the instruments involved are often complex, expensive, and incur high testing costs, making them unsuitable for rapid on-site detection. Therefore, developing a fast and convenient detection method is an urgent need.
Spectroscopic Analysis: A New Breakthrough in Ore Exploration
Traditional exploration techniques have long dominated ore exploration history, but their limitations have become increasingly apparent as the industry evolves. Classical chemical analysis involves complex steps like sample dissolution, separation, and titration, resulting in lengthy cycles – often taking days or even weeks from sampling to results – and high costs due to significant reagent consumption and demanding operator expertise. In scenarios requiring rapid assessment of vein direction or timely adjustment of exploration plans, this method struggles to meet real-time monitoring needs, potentially leading to missed optimal exploration windows.
Moreover, chemical analysis is highly destructive; samples are dissolved or decomposed, permanently losing structural and textural information crucial for subsequent studies on mineral genesis and evolution.
Traditional methods also suffer from low data acquisition efficiency. In complex mountainous terrain with difficult access, relying on single-point sampling followed by lab analysis makes it challenging to gather large volumes of effective data quickly, hindering the ability to meet the demands for comprehensiveness and timeliness in complex geological settings. Optosky's fiber optic spectrometer, with its advantages in sensitivity, signal-to-noise ratio (SNR), stability, and scene applicability, has been successfully applied in malachite green detection for aquaculture.
ATP2000P Spectrometer: Core Advantages
-
Full spectrum (200–1100 nm): Detects mineral-specific absorption peaks (e.g., malachite).
-
High sensitivity: Resolution of 0.5-4.0 nm; detection limit to μg/kg.
-
Smart analysis: Neural network models enable rapid, automated mineral quantification.
-
Portable: Lightweight, USB-powered, ideal for field use.
Case Study: Rapid Malachite Detection
Samples and Experimental Setup
Samples were sourced from Fujian Zijin Copper Industry Co., Ltd. High-purity chlorite, calcite, quartz, malachite, and hematite were ground into powder (particle size: 0.074-0.038 mm) using a ball mill. Multiple groups of mixed minerals were prepared by combining these five powders at specific volume ratios to simulate natural copper oxide ore.
The spectral measurement system for mixed mineral samples consisted of a visible-near-infrared (Vis-NIR) spectral acquisition unit, a control unit, and a computer display unit. The acquisition unit included an Optosky ATP2000P Vis-NIR spectrometer (wavelength range: 200-1080 nm), a halogen light source, a standard calibration whiteboard, and UV quartz optical fibers. The control unit comprised a console enabling lifting, translation, and rotation, controlling the vertical movement of the fiber optic probe and the horizontal/rotational movement of the sample.
Integration time was set to 300 ms, with 50 averages, a pixel smoothing parameter of 7 pix, and a wavelength interval of 0.4 nm. The integrating sphere probe was maintained 2-3 mm from the sample to maximize the illuminated surface area (diameter: 10 mm), minimizing experimental error. The acquired raw sample spectra are as follows:
Spectral Preprocessing and Feature Wavelength Selection
Spectral data acquired by miniature spectrometers can be affected by noise and baseline drift, impacting model accuracy and stability. To mitigate these effects, preprocessing is essential before modeling. This study employed four preprocessing methods: Savitzky-Golay (SG) smoothing, First Derivative (FD), Standard Normal Variate (SNV), and Multiplicative Scatter Correction (MSC).
The original spectral data covered 400-1100 nm, containing 1744 wavelength points. Large data volumes can slow model analysis, and collinearity between spectra can interfere with model building. Therefore, feature wavelength selection was used to reduce model input dimensionality and eliminate irrelevant spectral data, improving model accuracy.
Model Building and Results Analysis
Samples, after feature wavelength selection, were split in a 4:1 ratio: 93 samples for the training set and 23 samples for the test set.
The results show a correlation coefficient (R²) of 0.9965 and a Root Mean Square Error of Prediction (RMSEP) of 0.0203. This indicates a high correlation between the BP model's predicted values and the actual values, with small prediction errors, demonstrating the model's high feasibility for mineral content detection.
Conclusion:
Spectroscopic analysis is a viable new method for determining mineral content. Studies have shown that rapid mineral detection using fiber optic spectrometers is both efficient and accurate, offering broad application prospects.
Spectral Diagnostics of Diesel Flame Radiation in Gasifiers
Application | UV Spectroscopy Reveals Adsorption Dynamics of Xanthate on Chalcopyrite
Related Article

The ATP7810 is a wide-band, high-resolution infrared grating spectrometer covering up to 0.9–5 μm. Featuring a motorized rotating grating, multiple detector options (InGaAs/MCT), and flexible interfaces (SMA905 or free space, USB/UART control), it delivers high SNR and stability for absorption/reflection/transmission spectroscopy, laser wavelength testing, and fiber optic sensing.
New Product Recommendation | ATP7810 Ultra-Wide Range Infrared Spectrometer Series

This study uses the ATP5200P UV-Vis spectrometer to investigate xanthate adsorption on chalcopyrite surfaces. By analyzing absorbance at 300 nm under controlled pH and temperature, the method optimizes flotation conditions for copper recovery, enabling real-time, sensitive detection of adsorption mechanisms in non-ferrous mineral processing.
Using the ATP5200P Spectrometer to Unravel Xanthate Adsorption and Separation Mechanisms
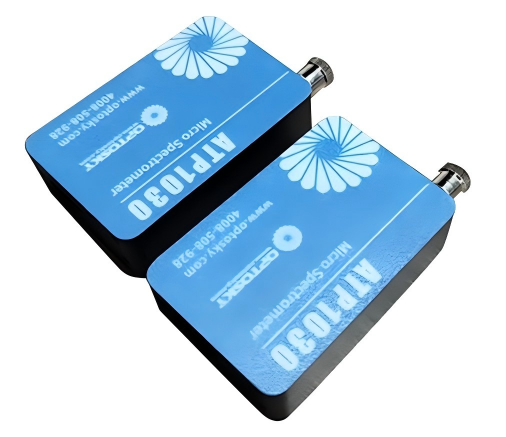
ATP1030 is an ultra‑compact, high‑resolution spectrometer covering 190–1100 nm. With a 1024‑pixel CMOS detector, adjustable integration time down to 1 ms, and USB‑powered design, it delivers reliable performance for applications like online water analysis, color measurement, handheld instruments, and Raman spectroscopy.
Product Recommendation | ATP1030 mini spectrometer Spectrometer

Vis-NIR transmission spectroscopy enables non-destructive identification of infertile duck eggs before incubation, achieving >95% accuracy. By detecting spectral fingerprints (e.g., 836 nm peak for fertile eggs), this method reduces energy waste and improves hatch rates, offering a low-cost, high-throughput solution for modern poultry farming.
Application case | How Spectral Technology is Transforming Duck Egg Farming