
Application of hyperspectral camera in industrial inspection
author: Yilia
2023-01-17
Application of hyperspectral camera in industrial inspection
——Testing cases of honeysuckle and mountain silver flower Chinese medicinal materials
1.Application requirements
Under darkroom conditions, honeysuckle and mountain silver flower with unknown content were detected, the detection area was 180×300mm,It can quickly respond to the spectrum of the measured object, and detect the content of honeysuckle and mountain silver flower in a certain area.It is convenient for medical staff to evaluate the tested samples, and it is also helpful to evaluate the quality of honeysuckle (or mountain silver flower),Drug efficacy, origin, etc. are analyzed.
2.Feasibility Analysis
In 2018, teachers such as Feng Jie and Liu Yunhong from the School of Food and Biological Engineering of Henan University of Science and Technology used high-light Spectrum imaging technology, to study a fast, accurate and non-destructive method to identify honeysuckle and mountain silver flower.By comparing the effects of the three preprocessing methods on the modeling effect of the partial least squares algorithm, it is found that SNV is the optimal preprocessing method for modeling. Using the regression coefficient method and continuous projection algorithm to select the characteristic wavelength of the preprocessed spectrum, and establish the discriminant analysis models of extreme learning machine and least squares support vector machine respectively.The results showed that after the spectrum was preprocessed by SNV, the characteristic wavelengths were extracted by SPA and the LS-SVM discriminant analysis model was established as the optimal discriminant model for Lonicerae japonica and Lonicerae japonica, and the recognition rates of both the modeling set and the prediction set reached 100.00%.Therefore, the use of hyperspectral imaging technology can non-destructively and effectively identify honeysuckle and mountain silver, and can realize the rapid discriminant analysis of honeysuckle and mountain silver under the full spectrum and characteristic wavelength. As shown in the figure below: the original spectrum of honeysuckle and mountain silver flower and the result after discrimination by PCA.
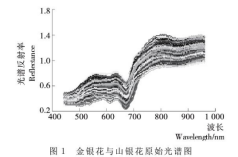
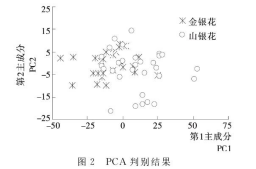
Fig 1 Fig 2
3.Hardware system
The hardware composition of the selected laboratory hyperspectral imaging system is shown in Figure 3. The system consists of a hyperspectral camera, a high-precision scanning stage, a high-definition camera, a high-stability linear light source, and a precision obscura.The core component hyperspectral camera is completely independently developed, using a 1-inch large target surface CCD image sensor with high spectral resolution, high sensitivity, large field of view and excellent imaging performance; the system realizes hyperspectral data acquisition through a high-precision scanning table, With self-developed linear light source and darkroom environment, stable and standardized hyperspectral data can be obtained.It adopts a 24-megapixel high-definition camera and combines hyperspectral imaging technology with high-definition camera technology to achieve the perfect fusion of high spatial resolution and hyperspectral resolution.
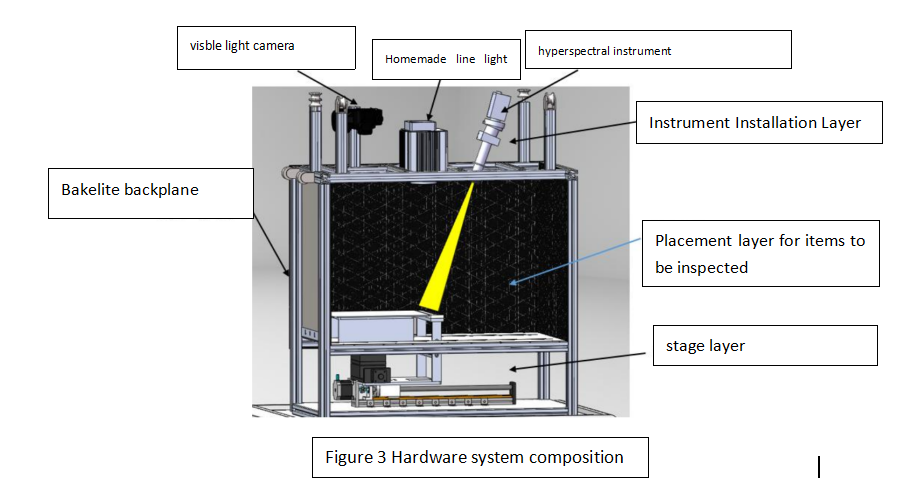
The hardware system parameter indicators are shown in the following table:
| Number | Index | Parameter | Note |
| 1 | Spectral range | 400-1000nm | / |
| 2 | Spectral resolution | Better than 2.3nm | 30um Silt |
| 3 | Spatial resolution | Better than 1mm | / |
| 4 | Number of spatial channels | 480/960 | 4-cell binning/2-pixel binning |
| 5 | Number of spectral channels | 270 | 4 cell |
| 6 | Dynamic Range | 12bits | / |
| 7 | Field of view width | 210mm | / |
| 8 | Scan range | 0~280mm | / |
| 9 | Material thickness | 0~50mm | / |
| 10 | Reflectance Calibration Plate | 3%,50% | / |
| 11 | Visible light camera resolution | 24 million pixels | / |
| 12 | Maximum frame rate | 80Hz | / |
| 13 | Spectroscopic system weight | Not more than 700g | / |
| 14 | Wide field of view | 31°@25mm 镜头 | / |
| 15 | Instantaneous field of view | 0.9mrad@f=35mm | / |
| 16 | Slit width | 30 μm | / |
| 17 | System Numerical Aperture | F/2.4 | / |
| 18 | Measurement environment | camera bellows | / |
4.Measurement Results and Conclusions
(1). Data processing method
According to the conventional processing method, with the reference plate as the reference, the reflectance is obtained, and the spectrum is smoothed to remove
(2). Spectral dimension noise.
Spectral feature analysis
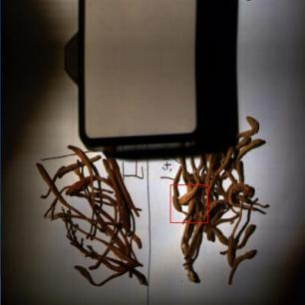
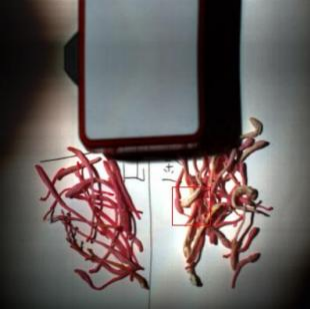
a True color composite image
b False color composite image
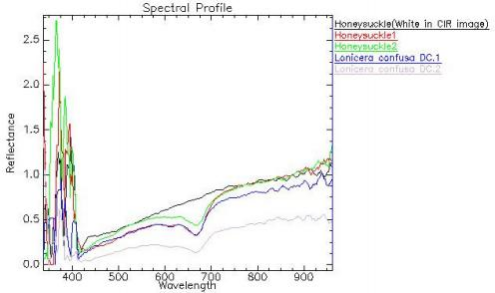
Figure 5 Spectral curves of samples
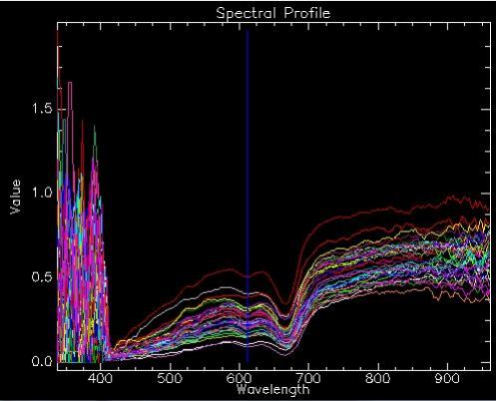
Fig. 6 Spectral characteristics of Liqun fragrans
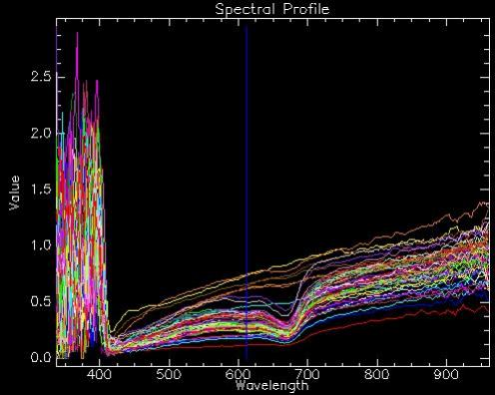
Figure 7 Spectral characteristics of honeysuckle
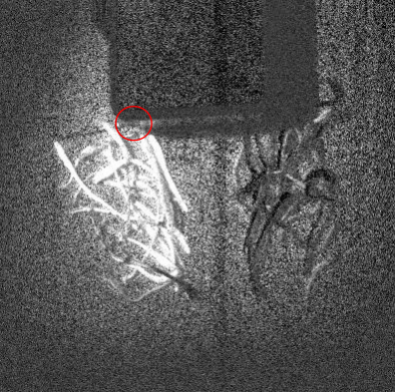
Figure 8 Absorption Strength
From the comparison between the true color image and the false color image, it can be seen that part of the petal color of honeysuckle in the false color image.
The tone is whitish (red box), inconsistent with the rest of the petals. The black curve in Figure 5 is the spectral curve of the white petals in the false-color image. It can be seen that in addition to the obvious spectral difference of the white honeysuckle petals, there are also some petals of honeysuckle and mountain silver. The spectral difference is small, and the morphological similarity larger case. Compare Figure 6 and Fig.
7 It can be seen that at the 119 band (611 nm) the spectrum of the mountain silver flower is different from that of the honeysuckle. The mountain silver flower has a relatively obvious absorption, and the absorption feature of the honeysuckle at this position is not obvious. Figure 8 is the absorption intensity graph, and it can be seen that the absorption intensity of Mountain Silver Flower is obvious.
According to the above characteristic analysis, the use of hyperspectral cameras can be used for industrial-grade sorting and identification of honeysuckle and mountain silver flowers.
Application of UAV-hyperspectral imaging for rice growth monitoring
Estimation Scheme of Rice Yield Based on UAV Hyperspectral Images
Related Article

Discover Optosky’s air–ground collaborative hyperspectral solution for mine ecological restoration monitoring. Combining UAV hyperspectral imaging, fixed-point rotating-scan systems, and field spectroradiometers, it supports vegetation, soil, mineral alteration, and water environment monitoring for green mine evaluation and restoration acceptance.
Applications | Hyperspectral Mine Restoration Monitoring
Compare single InGaAs and CMOS+InGaAs detector architectures in hyperspectral imaging. Learn why both can cover 400–1700 nm, how visible-light-extended InGaAs works, and the trade-offs in calibration, spectral registration, and system integration for applications in agriculture, food safety, and industrial inspection.
Technology | Single InGaAs vs. CMOS+InGaAs in Hyperspectral Imaging
Discover how hyperspectral imaging combined with multi-feature fusion (PCA + 2DCOS + CARS) enables non-destructive three-level grading of chili pepper sunburn with 97.2% accuracy. Learn about the ATH3000 system and Optosky's customized solutions for horticultural crop quality inspection and damage classification.
Can Sunburned Chili Peppers Be Non-Destructively Graded? Hyperspectral Imaging ATH3000 Offers a New Answer
Discover the Optosky ATH9600 multi-lens UAV-borne multispectral imaging system—featuring 67° ultra-wide FOV, synchronous snapshot, 3.75 μm large pixel, and native DJI X-Port integration. Ideal for large-area farmland monitoring, orchard management, pest early warning, water quality inversion, and complex crop classification. Born for efficient, all-weather low-altitude remote sensing.
Born for Large-Area Remote Sensing! Optosky Releases the ATH9600 Multi-Lens UAV-Borne Multispectral Imaging System