
Application of UV-Visible Spectrometer in Identification of Synthetic Emerald
2024-09-20
Introduction:
UV-Visible spectrum analysis is listed as a routine test item for jewelry and jade identification. Although the key evidence for identifying synthetic emeralds is its inclusion characteristics and infrared absorption spectrum characteristics, UV-visible absorption spectrum analysis can also provide information for identifying synthetic emeralds. Evidence has certain identification significance. This article uses a UV-visible spectrometer to collect the UV-visible (including some near-infrared) absorption spectra of samples. Through comparative analysis, it summarizes the identification characteristics of several common synthetic emerald types on the market under the UV-visible spectrometer.
UV-Visible Spectrometer :
With the development of spectroscopy, spectrometers have become more and more widely used in the field of gem identification, especially micro spectrometers. Different from large UV-visible spectrophotometers, UV-visible spectrometers use optical fibers to transmit signals to the spectrometer, and use CCD array detectors to convert photoelectric signals, which can achieve simultaneous full-band detection, and measurement results can be collected for multiple times. The final result has the advantages of high detection efficiency, small sample physical state restrictions, easy operation, small instrument size, and low investment cost.
The UV-visible spectrometerATP2000P used in this article uses a micro-spectrometer as the core detector and a spectrum analyzer based on reflectance measurement. The detector used in this instrument can respond to light waves with a wavelength of 1180nm, so it can also collect part of the near-infrared spectrum information.
Synthetic Emerald:
Emerald is a precious and high-end gemstone. Natural emerald is rarely produced in nature, and its resources are becoming increasingly depleted as people continue to mine them. With the improvement of people's living standards, the market demand for high-end emeralds is increasing. The objective contradiction between supply and demand has given rise to a series of methods for optimizing the processing and synthesis of emeralds.
Currently, the synthetic emeralds on the market are mainly synthesized by flux method and hydrothermal method. Traditional emerald identification usually uses gem microscope, refractometer, UV fluorescent light box and Charles color filter as the main detection tools. With the development of synthetic technology, the challenges to traditional detection methods are becoming greater and greater, and the testing experience of inspectors is increasingly tested. However, as a jewelry inspection and testing center, it is an inevitable trend for the development of inspection and testing methods to weaken the testing risks caused by experience and pay more and more attention to scientific testing data.
The main identification characteristics of synthetic emeralds at present:
(1) Characteristics of inclusions: flux residue, nail-shaped cinnamon beryllium crystals, metal platinum flakes, wavy or stirring growth lines, fishbone-shaped growth lines, etc.
(2) Infrared spectrum characteristics: emerald synthesized by traditional hydrothermal method has a set of comb-shaped infrared absorption spectrum peaks mainly at 2983, 2815, and 2615 cm-1, which are related to CI- in the mineralizer. The emerald synthesized by the flux method contains almost no water, showing no absorption above 3000 cm-1; the emerald synthesized by the hydrothermal method has absorption peaks at 5442 cm-1 and 5272 cm-1, indicating that it has type I water and type II water. , but the vibration peak of water molecules is different from that of natural emerald.
In addition to the above identification characteristics, the UV-visible spectrometer used in this article provides another effective detection method and analysis method for identifying natural emeralds and synthetic emeralds.
Samples and Test Methods:
The test samples this time are 3 natural emeralds: NE01, NE02, NE03; 5 emeralds synthesized by hydrothermal method: SE01, SE02, SE03, SE04, SE05; 1 emerald synthesized by flux method: SE06.
The micro spectrometerATP2000P produced by Optosky (Xiamen) Optoelectronics Co., Ltd. is used. Test conditions: integration time 500 ms, average times 2 times, scanning range 180~1100nm, room temperature.
Test Results and Analysis:
Ultraviolet-visible-near-infrared absorption spectrum characteristics of natural emerald
The chromogenic elements in emerald are the main factors affecting its UV-visible absorption spectrum. The absorption peak of Cr3+ is located near 273 nm, which is the absorption caused by the 4A2→4T1 (4P) transition; the absorption peak caused by the 4A→4T1 (4F) transition near 427 nm. Absorption; absorption generated by the 4A2→4T2 (4F) transition near 612nm.
Among the three natural emerald NE01, NE02 and NE03 samples tested this time (Figure 1):
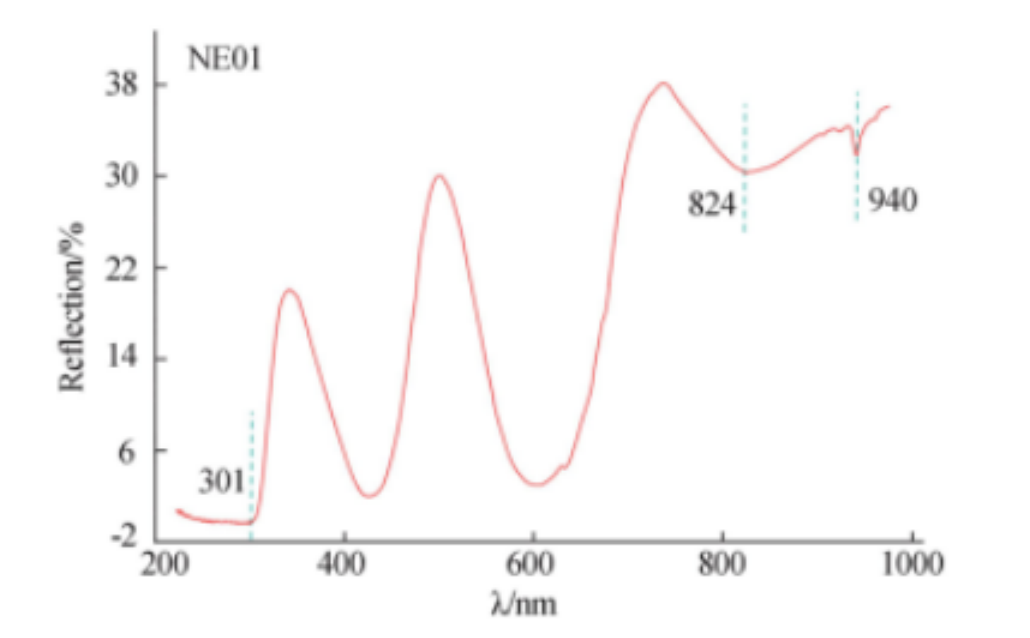
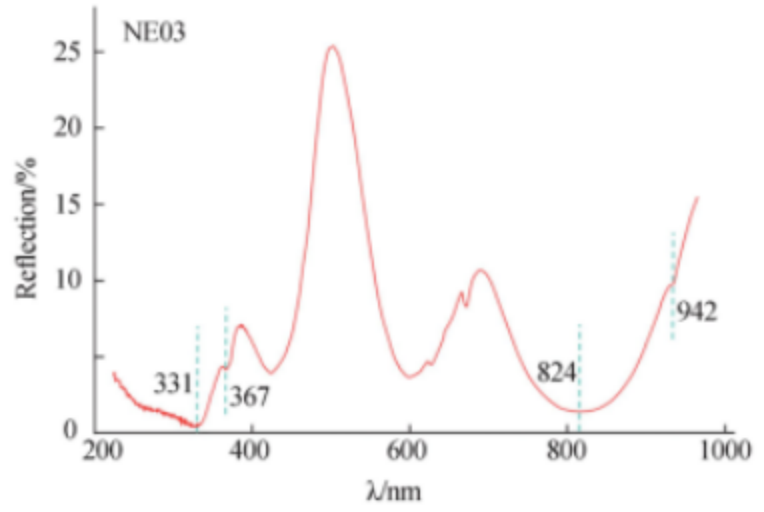
Figure 1 UV-visible NIR absorptio spectra of natural emeralds NE01, NE02, and NE03
(1) The cut-off edges of the UV region absorption broad peaks of the three samples are located at 301 nm, 315 nm, and 331 nm respectively. This is caused by O2-→Fe3+ charge transfer. As the Fe3+ content in NE01, NE02, and NE03 increases, The absorption cutoff edge of the oxygen-iron charge shift band is red-shifted. Among them, NE03 has the largest Fe3+ content, and an absorption peak of 367 nm appears, which is caused by the 6A1→4E (D) transition of Fe3+.
(2) The three samples each have gradually increasing broad absorption peaks at 823~830nm. The assignment of this peak position is controversial. One view is that it is caused by the 5T2g→5Eg transition of Fe2+, and another view is that it is caused by Fe2+ and It is caused by the charge transfer between Fe3+, and there is also a view that it is caused by the absorption of hydrated ions of Fe3+. Research shows that the absorption peak at this position may be caused by the combined effect of the d-d electron transition of Fe3+ and the charge transfer of Fe2+-Fe3+. Based on the opinions of all parties, it is believed that this peak position is related to iron, and the absorption characteristics of natural emerald at this position have certain identification significance.
(3) Three samples have absorption near 940nm, and this peak is caused by the second-order frequency doubling vibration of water.
Ultraviolet-visible-near-infrared absorption spectral characteristics of emerald synthesized by hydrothermal method
Performance characteristics of SE01, SE02, and SE03 (Figure 2)
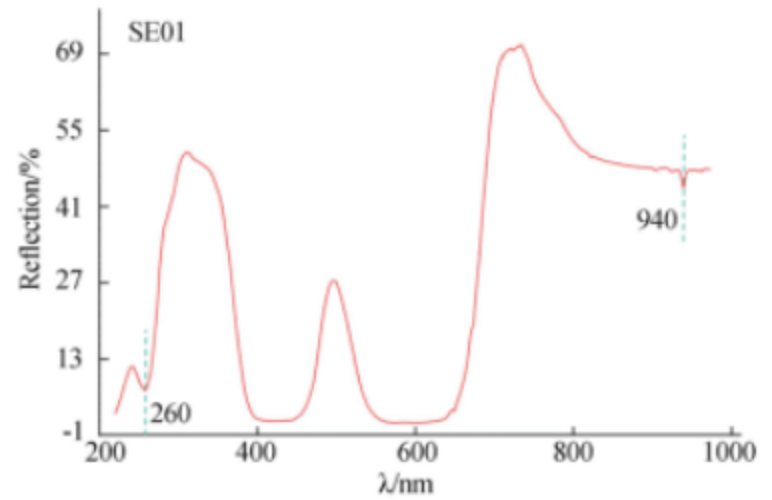
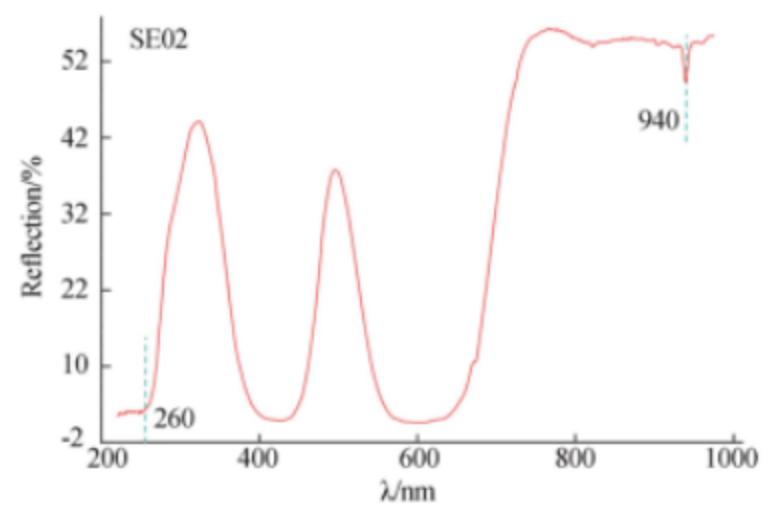
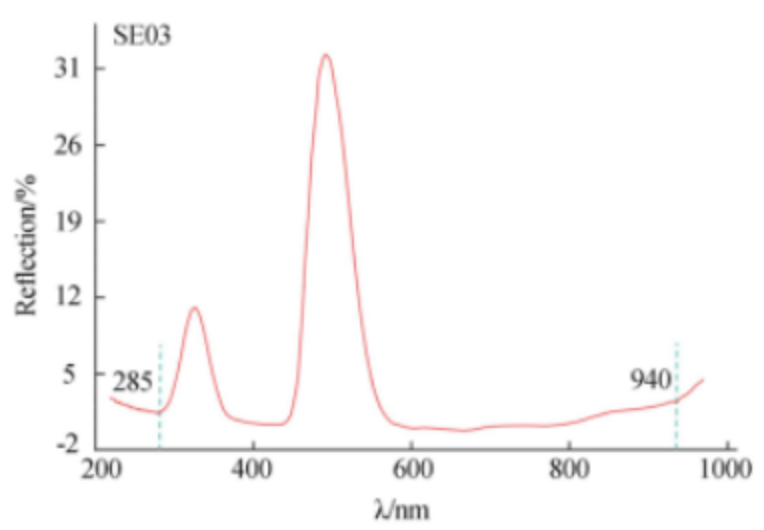
Figure 2 UV-visible and NIR absorption spectra of emeralds SE01, SE02, and SE03 synthesized by hydrothermal method
(1) The absorption cutoff edges in the ultraviolet region are all less than 290 nm, and there is no oxygen-iron charge transfer band, which means that the three samples do not contain iron ions. According to the law that chromium in natural minerals must contain iron, it means that these three samples contain iron. Green is a laboratory synthesis. This feature can be used as a basis for identification of synthetic emeralds that do not contain iron.
(2) SE01 and SE02 have no characteristic absorption near 820nm, and SE03 has a wide absorption of 580~780 nm, which is an absorption caused by V3+ and Cu2+.
(3) The absorption peak of water appears near 940nm.
Performance characteristics of SE04 and SE05 (Figure 3)
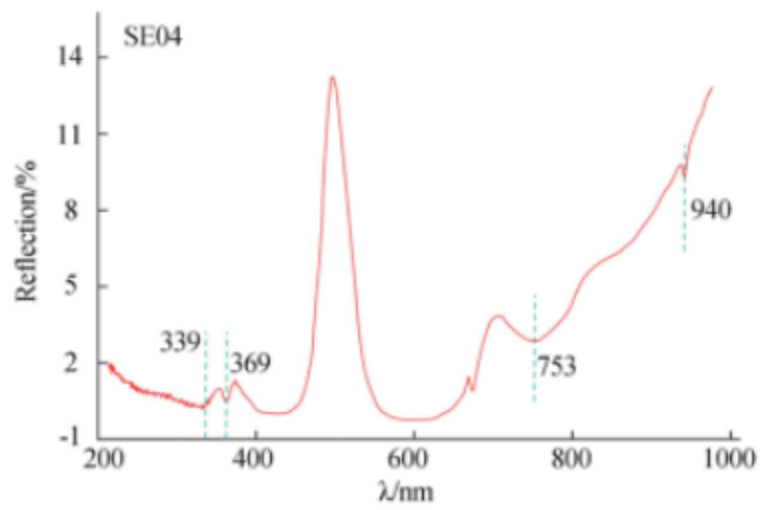
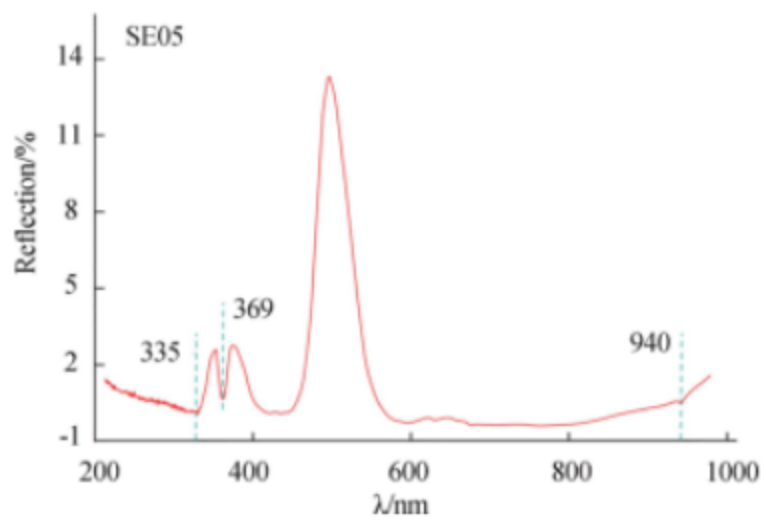
Figure 3 UV-visible and NIR absorption spectra of emeralds SE04 and SE05 synthesized by hydrothermal method
(1) The cut-off edges of the absorption peaks in the ultraviolet region are 339 nm and 335 nm respectively. There is an absorption peak in the range of 300~345 nm caused by the oxygen iron charge transfer band. At the same time, there is an absorption peak around 369 nm caused by the 6A1g→4E(D) transition of Fe+. The consistent absorption peaks indicate that the two samples contain a certain amount of iron ions.
(2) SE04 has a broad absorption peak centered at 753 nm. This absorption peak is caused by the forbidden energy level transition of Fe3+ from 6A1g to 4T2g, and can be used as a basis for identification of iron-rich synthetic emeralds. SE05 has a wide absorption of 580~780 nm, which is caused by V3+ and Cu2+.
(3) The absorption peak of water appears near 940nm.
UV-visible-near-infrared absorption spectrum characteristics of emerald synthesized by flux method
One emerald synthesized by the flux method in this test showed an anhydrous absorption peak (Figure 4)
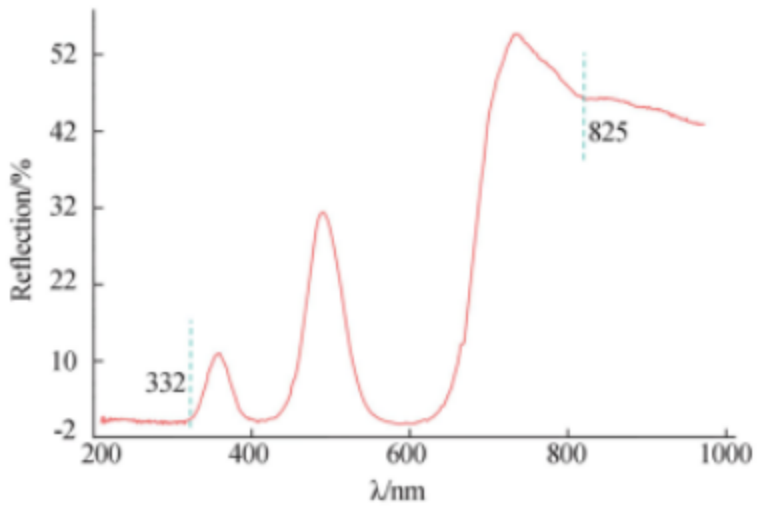
Figure 4 UV-visible-near-infrared absorption spectrum of emerald SE06 synthesized by cosolvent method
However, the infrared spectrum and UV-visible absorption spectrum of emeralds synthesized by the flux method recently show the presence of trace amounts of water, and most natural emeralds show very weak water absorption peaks in the UV-visible spectrometer, so only UV The visible spectrometer cannot make an accurate judgment on the emerald synthesized by the flux method, and the judgment should be made based on the inclusion characteristics and infrared spectral characteristics.
Conclusion :
- Iron-free Cr type (SE01), Cr+V type (SE02), and V+ can be identified by whether there is an oxygen-iron charge transfer absorption band in the range of 300~345 nm caused by O2-→Fe3+ charge transfer. Cu type (SE03) hydrothermal synthesis of emerald.
- Through the appearance of a broad absorption peak near 760nm caused by the forbidden energy level transition of Fe2+ from 6A1g to 4T2g, more Russian new hydrothermal synthetic emeralds that have recently appeared on the market can be identified. The inclusion characteristics and infrared spectrum characteristics of this new type of hydrothermal-synthesized emerald are very similar to Colombian emeralds. The ultraviolet-visible spectrum absorption characteristics can be used as an important basis for identifying this type of emerald.
- Recently, the infrared spectrum and UV-visible absorption spectrum of emeralds synthesized by flux method show the presence of trace amounts of water, while most natural emeralds show very weak water absorption peaks in UV-visible spectrometer, so only It is impossible to make an accurate judgment on the flux-method-synthesized emerald using a UV-visible spectrometer, and the judgment should be made based on the inclusion characteristics and infrared spectral characteristics.
Application of spectrometer in color measurement
ATZW300 Passion Fruit Online Detection Proposal
Related Article

The ATP7810 is a wide-band, high-resolution infrared grating spectrometer covering up to 0.9–5 μm. Featuring a motorized rotating grating, multiple detector options (InGaAs/MCT), and flexible interfaces (SMA905 or free space, USB/UART control), it delivers high SNR and stability for absorption/reflection/transmission spectroscopy, laser wavelength testing, and fiber optic sensing.
New Product Recommendation | ATP7810 Ultra-Wide Range Infrared Spectrometer Series

This study uses the ATP5200P UV-Vis spectrometer to investigate xanthate adsorption on chalcopyrite surfaces. By analyzing absorbance at 300 nm under controlled pH and temperature, the method optimizes flotation conditions for copper recovery, enabling real-time, sensitive detection of adsorption mechanisms in non-ferrous mineral processing.
Using the ATP5200P Spectrometer to Unravel Xanthate Adsorption and Separation Mechanisms

ATP1030 is an ultra‑compact, high‑resolution spectrometer covering 190–1100 nm. With a 1024‑pixel CMOS detector, adjustable integration time down to 1 ms, and USB‑powered design, it delivers reliable performance for applications like online water analysis, color measurement, handheld instruments, and Raman spectroscopy.
Product Recommendation | ATP1030 mini spectrometer Spectrometer

Vis-NIR transmission spectroscopy enables non-destructive identification of infertile duck eggs before incubation, achieving >95% accuracy. By detecting spectral fingerprints (e.g., 836 nm peak for fertile eggs), this method reduces energy waste and improves hatch rates, offering a low-cost, high-throughput solution for modern poultry farming.
Application case | How Spectral Technology is Transforming Duck Egg Farming