
Application of spectrometer in color measurement
2024-01-24

Introduction: Why do substances have colors?
Under the action of energy provided by a light source (such as bright sunlight), the electrons in the atoms that make up the material elements undergo a transition from the ground state to the excited state, and then back to the ground state from the excited state, causing the material to selectively absorb or emit the corresponding specific light waves, thereby displaying their unique colors.
For example: most metals appear silvery white because there are a large number of empty orbitals in the upper part of the metal's energy band, and the energy difference between adjacent orbits is very small. Therefore, when photons of any wavelength enter the metal surface, they can excite free electrons inside the metal to empty orbits in the upper part of the energy band, but the electrons quickly jump back to a lower energy state and emit photons (the energy of a few photons will converted into heat energy), so the vast majority of photons enter the reflected wave, and since the reflected light generally includes light of all visible wavelengths, most metals appear silvery white. However, a few metals are special. For example, pure gold is reddish-yellow and pure copper is purple-red. The main reason is that after the d electrons in the outer layer of the metal ions in their crystals absorb short-wavelength light such as blue-violet, they will jump to the empty energy level of the s energy band, so the reflected light on their surfaces contains less blue-violet light, thus showing varying degrees of yellow and red.
Spectral Colorimetry Technology
The traditional color measurement method is directly observed by the human eye. Generally, the band that the human eye can perceive is 380~780nm. This method is simple and flexible, but the results are greatly affected by personnel and environment, making the measurement results inaccurate and difficult to be fair. In order to objectively measure the color of an object, the International Commission on Illumination (CIE) developed a standard colorimetric system, the CIE1931 system: a quantitative description of color through color tristimulus values XYZ. This provides the basis for color measurement.
Figure 1 CIE 1931 system.
As mentioned before: when a light source shines on an object, the object selectively reflects or absorbs the spectrum. Spectral colorimetry uses a spectrometer to obtain the relative spectrum S (λ) of the light source, the transmittance spectrum T (λ) of the transmitting object, and the spectral reflectance R (λ) of the reflecting object. Thus, the color stimulus φ (λ) of the object to be measured is obtained, and then according to the color tristimulus value formula of colorimetry, the tristimulus values X, Y, and Z of the color of the object to be measured can be obtained, thereby determining the color of the object to be measured.
The color tristimulus value formula is:
X = ∫x(λ)φ(λ)dλ,
Y = ∫y(λ)φ(λ)dλ,
Z = ∫z(λ)φ(λ)dλ
Among them, x(λ), y(λ), and z(λ) are the three colorimetric matching functions in the CIE standard colorimetric system. φ(λ) is the color stimulation function: for self-illuminating objects, φ(λ)=S(λ), S(λ) is the relative spectral distribution of luminous objects, for transmissive objects, φ(λ)=T(λ)S (λ), T(λ) is the spectral transmittance of the object to be measured, for reflective objects, φ(λ) = R(λ)S(λ), R(λ) is the spectral reflectance of the object to be measured.
Application case: ATP2400 measures paper of different colors
In this measurement we use a spectrometer ATP2400 with a wavelength range from 200 to 1100 nm and a resolution (FWHM) of 3 nm. As shown below: Connect the white light continuous light source and spectrometer ATP2400 through Y-shaped optical fiber. The other end is connected to the reflective fiber optic probe. In addition, connect the ATP2400 to the computer and open the test software.
Figure 2 Connection diagram of ATP2400 measuring different colors of paper.
Test method flow
Turn off the light source, cover the probe, stay in darkroom conditions, and collect dark background.
Turn on the light source, set the spectrometer integration time to 2500ms and the number of scans to 1 according to the blank intensity.
Change the position of the probe, test papers of different colors, and obtain spectral information respectively.
Test results and analysis
As shown in the figure, the spectral information of different colors is obtained:
1. Each color has a feature at 600-610nm, 760-780nm, and 900nm.
2. The black spectrum has the lowest intensity. White and pink spectra have the highest intensity.
3. White/pink/grey has characteristic peaks at 480nm, and yellow/orange/green/red has characteristic peaks at 500~510nm.
Application Of NIR Spectrometer In Garbage Sorting
Application of UV-Visible Spectrometer in Identification of Synthetic Emerald
Related Article

The ATP7810 is a wide-band, high-resolution infrared grating spectrometer covering up to 0.9–5 μm. Featuring a motorized rotating grating, multiple detector options (InGaAs/MCT), and flexible interfaces (SMA905 or free space, USB/UART control), it delivers high SNR and stability for absorption/reflection/transmission spectroscopy, laser wavelength testing, and fiber optic sensing.
New Product Recommendation | ATP7810 Ultra-Wide Range Infrared Spectrometer Series

This study uses the ATP5200P UV-Vis spectrometer to investigate xanthate adsorption on chalcopyrite surfaces. By analyzing absorbance at 300 nm under controlled pH and temperature, the method optimizes flotation conditions for copper recovery, enabling real-time, sensitive detection of adsorption mechanisms in non-ferrous mineral processing.
Using the ATP5200P Spectrometer to Unravel Xanthate Adsorption and Separation Mechanisms
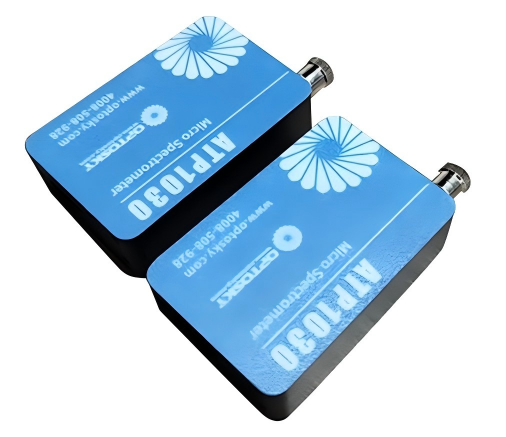
ATP1030 is an ultra‑compact, high‑resolution spectrometer covering 190–1100 nm. With a 1024‑pixel CMOS detector, adjustable integration time down to 1 ms, and USB‑powered design, it delivers reliable performance for applications like online water analysis, color measurement, handheld instruments, and Raman spectroscopy.
Product Recommendation | ATP1030 mini spectrometer Spectrometer

Vis-NIR transmission spectroscopy enables non-destructive identification of infertile duck eggs before incubation, achieving >95% accuracy. By detecting spectral fingerprints (e.g., 836 nm peak for fertile eggs), this method reduces energy waste and improves hatch rates, offering a low-cost, high-throughput solution for modern poultry farming.
Application case | How Spectral Technology is Transforming Duck Egg Farming