
Product Introduction | ATP2000 Series Cost-effective Spectrometer
author: Eliza
2024-10-21
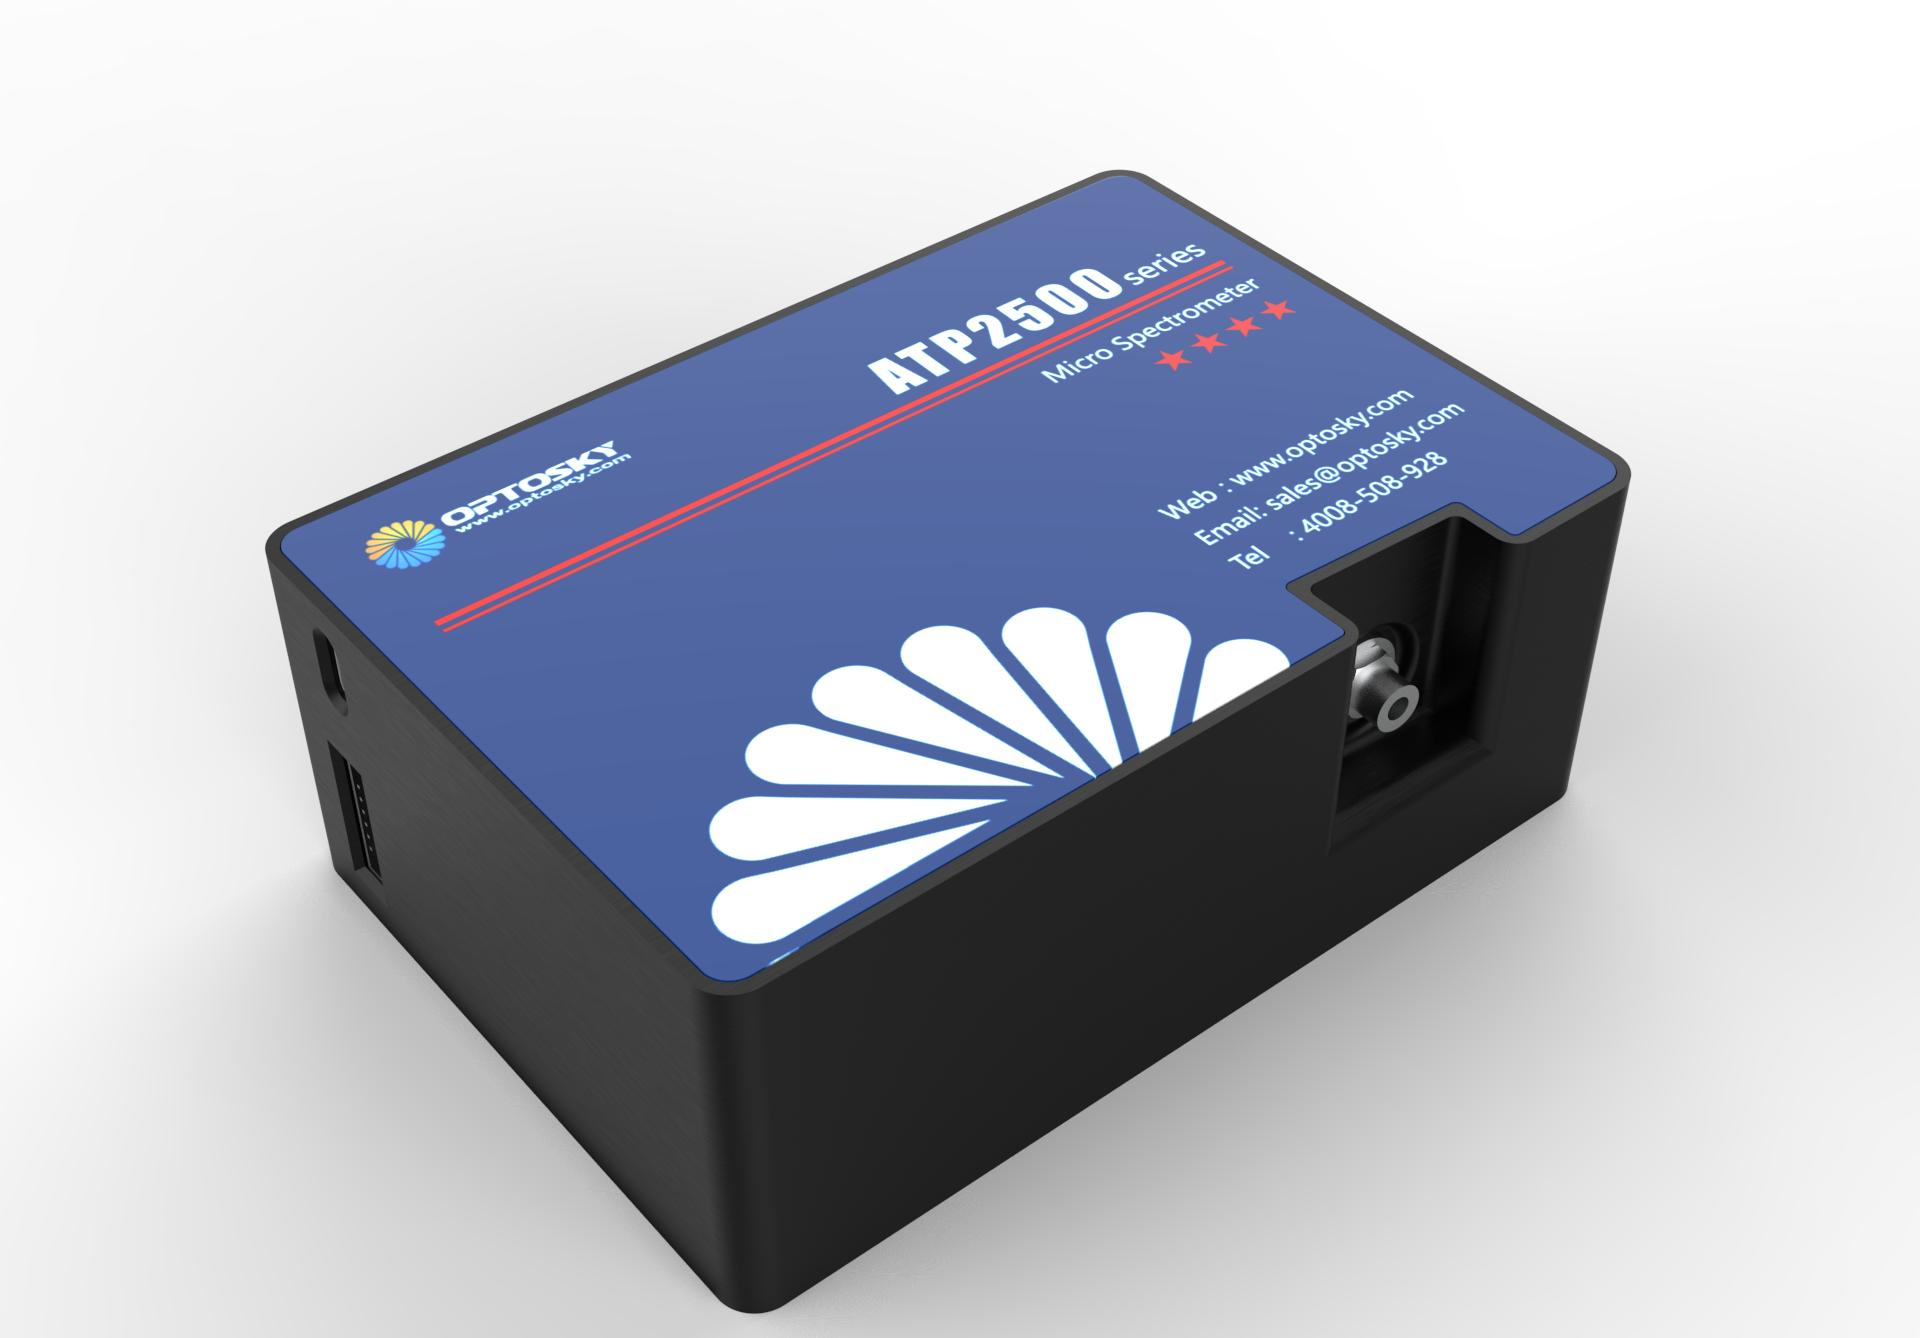
Overview
The ATP2000 Series, developed by Optosky based on years of in-depth experience in the spectrometer industry, is a cost-effective spectrometer line. After more than a decade of continuous optimization and improvement, this series offers models with high signal-to-noise ratio, high frame rates, high resolution, and low noise, all while maintaining cost-efficiency and compactness. The ATP2000 series fiber optic spectrometers are widely favored by the market and customers for their exceptional stability, catering to a wide range of applications.
Features
High cost performance
High pixel UV enhanced detector
190-1100nm wide band range
0.2-5nm high resolution
Fast frame rate, shortest exposure time up to 0.2ms
Specifications
Specifications
The ATP2000 Series uses a UV-enhanced linear CMOS detector from Hamamatsu with either 2048 or 4096 pixels, capable of operating within a wavelength range of 190-1100 nm. The detector's minimum exposure time can be as short as 0.2 ms, allowing precise control over spectral measurement time for customers.
|
Model
|
Description
|
|
ATP2000P
|
High signal-to-noise ratio, the highest frame rate is about 300Hz
|
|
ATP2000H
|
High-speed fiber spectrometer, frame rate reaches 1Kfps
|
|
ATP2000SH
|
Ultra-high-speed fiber spectrometer, frame rate up to 4Kfps (4KHz), Gigabit Ethernet output
|
|
ATP2002
|
Built-in pulse xenon lamp drive circuit, ultra-low noise CMOS signal processing circuit
|
|
ATP2400
|
Small size, light weight
|
|
ATP2500
|
Using concave grating, ultra-low stray light, suitable for rapid detection
|
|
ATP2700
|
High-sensitivity, high-transmittance micro-fiber spectrometer, using large numerical aperture optical design,
can receive all photons of the optical fiber (numerical aperture is 0.22)
|
|
Detector
|
Parameter
|
ATP2000P
|
ATP2000H
|
ATP2000SH
|
ATP2002
|
ATP2400
|
ATP2500
|
ATP2700
|
|
Type
|
UV-enhanced linear array CMOS
|
|||||||
|
Effective pixels
|
2048
|
|||||||
|
Pixel size
|
14x200um
|
|||||||
|
Optical parameters
|
Maximum wavelength range
|
190-1100nm
|
||||||
|
Optical resolution
|
0.1-3 nm
|
|||||||
|
Signal-to-noise ratio
|
>450:1
|
|||||||
|
Dynamic range
|
3000 : 1
|
|||||||
|
Optical design
|
Crossed asymmetric C-T optical path
|
Concave grating optical path
|
Same as ATP2002
|
|||||
|
Physical parameters
|
Dimensions/mm
|
102x72x34
|
127x72x24
|
85x61x24
|
102x72x34
|
171x70x48
|
||
|
Weight/g
|
239
|
270
|
150
|
200
|
270
|
|||
Application
Industrial Measurement Sensors
LED Spectrophotometer
Multi-Parameter Online Water Quality Analyzer
UV Gas Analyzer
Fluorescence Spectrophotometer
Biochemical Analyzer
Transmittance and Reflectance Detection
LIBS
Product Operation
Typical Optical Path:
Figure 1. Reflectance Measurement Optical Path
ATP2000 Test Spectrum:
· Fast, Ultra-Micro Spectrophotometer
· Environmental Instruments (Flue Gas, Water Quality)
· Transmittance and Reflectance Detection
Figure 2. Dark Background and Dark Noise Test
Dark Background: 146 counts @ 1 ms; Dark Noise: ±40 @ 1 ms.
Test Method: After connecting the device, block the spectrometer’s input aperture with a screw cap to prevent external light from entering. Open the Optosky Spectra software and click "Display Settings" → "X-axis Unit" → "Wavelength" → "Integration Time (1 ms, 10 ms, 100 ms, 1 s)" → "Dark." The resulting spectrum, shown in Figure 3, indicates the dark background, calculated by subtracting the minimum value from the maximum value of the signal intensity on the Y-axis. Then, by clicking "Single Acquisition," the resulting spectrum shows the range of signal intensity on the Y-axis, which is the dark noise value.
Figure 3. Intensity Repeatability Test
Click "Display Settings" → "X-axis Unit" → "Wavelength" → "Integration Time (select the integration time that reaches 80% of full signal intensity)" → "Dark." After subtracting the dark background, illuminate with a halogen lamp to obtain the spectrum. Select six representative wavelengths from the spectrum and record them. Then, click "Display Settings" → "X-axis Unit" → "Time (set six points based on the recorded wavelengths)" → "Continuous Acquisition." After approximately 10 minutes, pause and save the data. Use the intensity repeatability calculation formula to analyze the results.
Figure 4. Response Linearity Test
Click "Display Settings" → "Number of Curves" → "Others" and select 10 curves to complete the setup. Divide 40,000 counts corresponding to the integration time into 10 equal parts, and sequentially click "Single Acquisition" to obtain spectra of varying intensities, continuing until 10 spectra are collected. Save the data and substitute it into the response linearity calculation formula. The test result is: R² = 0.9997.
Figure 5. Resolution Test - Hg Spectrum
Test Results:0.680 nm @ 794.82 nm、0.704 nm @ 826.45 nm、0.816 nm @ 912.30 nm
ATP2400 Test Spectrum:
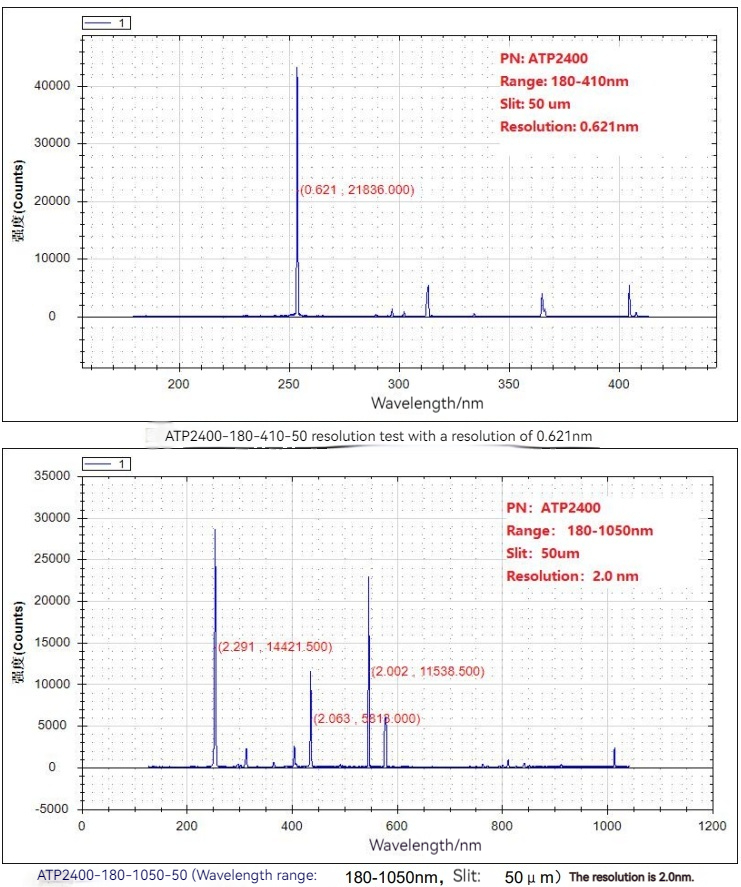
Figure 6. ATP2400 Resolution Test
Optosky Fiber Optic Spectrometer Product Series
As a multi-purpose, cost-effective mini fiber optic spectrometer series launched by Optosky, the ATP2000 Series products have been widely applied across various industries. For any related inquiries, please feel free to contact us at any time. Optosky is dedicated to supporting scientific research and is here to serve you!
Enhancing Tissue Identification with Spectroscopy Precision
Enhancing the Solar Industry with Spectroscopy
Related Article

The ATP7810 is a wide-band, high-resolution infrared grating spectrometer covering up to 0.9–5 μm. Featuring a motorized rotating grating, multiple detector options (InGaAs/MCT), and flexible interfaces (SMA905 or free space, USB/UART control), it delivers high SNR and stability for absorption/reflection/transmission spectroscopy, laser wavelength testing, and fiber optic sensing.
New Product Recommendation | ATP7810 Ultra-Wide Range Infrared Spectrometer Series

This study uses the ATP5200P UV-Vis spectrometer to investigate xanthate adsorption on chalcopyrite surfaces. By analyzing absorbance at 300 nm under controlled pH and temperature, the method optimizes flotation conditions for copper recovery, enabling real-time, sensitive detection of adsorption mechanisms in non-ferrous mineral processing.
Using the ATP5200P Spectrometer to Unravel Xanthate Adsorption and Separation Mechanisms
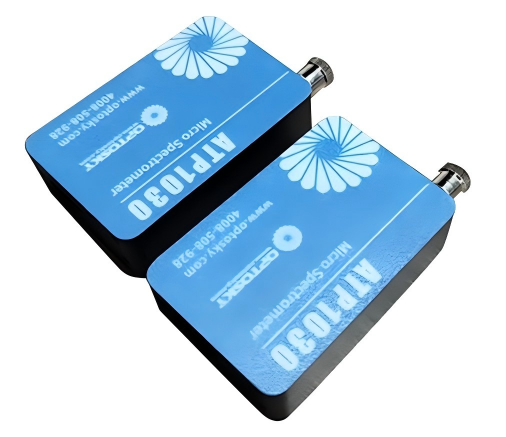
ATP1030 is an ultra‑compact, high‑resolution spectrometer covering 190–1100 nm. With a 1024‑pixel CMOS detector, adjustable integration time down to 1 ms, and USB‑powered design, it delivers reliable performance for applications like online water analysis, color measurement, handheld instruments, and Raman spectroscopy.
Product Recommendation | ATP1030 mini spectrometer Spectrometer

Vis-NIR transmission spectroscopy enables non-destructive identification of infertile duck eggs before incubation, achieving >95% accuracy. By detecting spectral fingerprints (e.g., 836 nm peak for fertile eggs), this method reduces energy waste and improves hatch rates, offering a low-cost, high-throughput solution for modern poultry farming.
Application case | How Spectral Technology is Transforming Duck Egg Farming