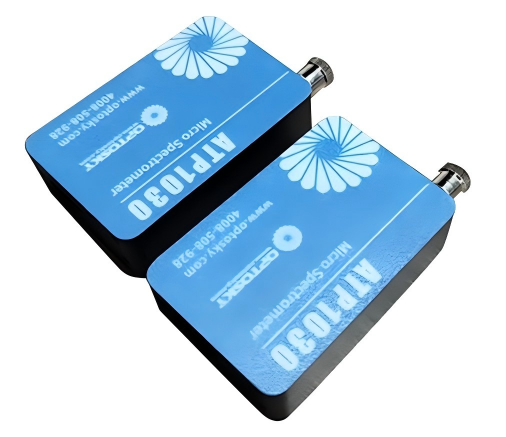
Product Introduction | ATP3000 Series High Resolution Spectrometers
Overview
The ATP3000 Series is a low-noise, high-resolution fiber optic spectrometer, equipped with a 2048 or 4096 pixel linear CMOS sensor. Combined with a low-noise signal processing circuit, it delivers an ultra-high optical resolution of up to 0.05nm, providing fast and accurate spectral data acquisition.
With its high A/D converter frequency and high-speed data transmission, the ATP3000 Series is ideal for rapid detection applications.
Features
- Low noise
- High resolution (0.05-2nm)
- Ultra-slim design
- 2048 or 4096 pixel linear array CMOS detector
- 190-1100nm wavelength range (UV or IR optimized)
- High A/D converter frequency and high-speed data transmission
Specifications
|
Model |
Description |
|
ATP3000 |
High-resolution fiber optic spectrometer |
|
ATP3030/4 |
High-resolution UV-optimized low-noise, ultra-thin M-type optical path UV-optimized fiber optic spectrometer, 14 (4096 pixels) |
|
ATP3330/4 |
High-resolution IR-optimized low-noise, ultra-thin M-type optical path IR-optimized fiber optic spectrometer, 14 (4096 pixels) |
|
Parameter |
ATP3000 |
ATP3030 |
ATP3034 |
ATP3330 |
ATP3334 |
|
|
Detector |
Type |
UV-enhanced linear array CMOS |
||||
|
Effective pixels |
2048 |
2048 |
4096 |
2048 |
4096 |
|
|
Pixel size |
14x200μm |
14x200μm |
7x200μm |
14x200μm |
7x200μm |
|
|
Optical parameters |
Maximum wavelength range |
190-1100nm |
190-1100nm(UV Optimization) |
190-1100nm(Infrared Optimization) |
||
|
Optical resolution |
0.05-2 nm |
|||||
|
Signal-to-noise ratio |
450:1 |
|||||
|
Dynamic range |
3000:1 |
|||||
|
Optical design |
Crossed asymmetric C-T optical path |
M-type optical path |
M-type optical path |
|||
|
Physical parameters |
Dimensions/mm |
170x110x52 |
124x90x38 |
125x90x32 |
||
|
Weight/g |
800 |
500 |
500 |
|||
ATP3000
The ATP3000 builds upon the second-generation ATP3000, further improving the signal-to-noise ratio and dynamic range. It offers high measurement stability, unaffected by changes in operating environment temperature, enhancing the reliability of the measurement results.
The ATP3000 can be powered directly through a USB port, with data output interfaces available in either USB 2.0 or UART, making it convenient for integration.
|
Extended Models |
Features |
|
ATP3000 |
2048 pixels |
|
ATP3000-LVF |
Built-in LVF to eliminate multi-level diffraction |
|
ATP3000-4 |
4096 pixels |
ATP3000 Dark Noise
ATP3030/4
ATP3030/4 is an ultra-high resolution micro-spectrometer developed by our company. The highest resolution can reach 0.05nm, which is suitable for various high-resolution applications. At the same time, it has the characteristics of high reliability, ultra-high speed, low cost, high cost performance, etc., and can be used in various environmental applications such as online testing.
ATP3030/4 is very suitable for fast detection due to its high A/D converter frequency and high-speed data transmission. In the ATP3030/4 memory chip, algorithms that improve performance such as wavelength calibration coefficients and linearity coefficients are solidly programmed. ATP3030/4 operates from a single +5V DC power supply provided by USB or UART.
|
Extended Models |
Features |
|
ATP3030 |
2048 pixels |
|
ATP3034 |
4096 pixels |
|
ATP3030-LVF |
Built-in LVF to eliminate multi-level diffraction |
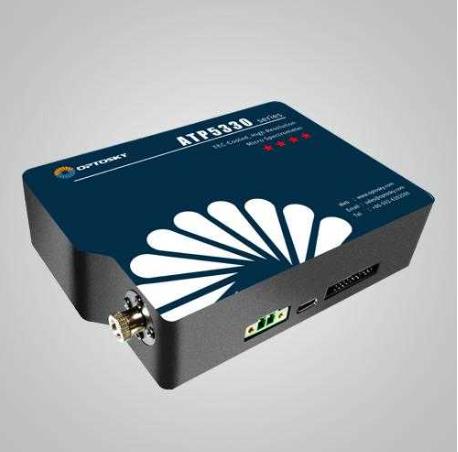
ATP3330/4
The ATP3330/4 Spectrometer is a newly developed ultra-thin, ultra-high-resolution mini spectrometer by Optosky, utilizing Optosky’s proprietary M-type optical structure for exceptional high-resolution performance. It is equipped with a 2048 or 4096 pixel linear array detector, further enhancing optical resolution, with a maximum resolution of 0.05nm, making it suitable for various high-resolution applications.
Compared to the ATP3030/4 Spectrometer, the ATP3330/4 has improved resolution through optimized optical paths and increased sensitivity by raising the NA value. The ATP3330/4 features high reliability, ultra-fast operation, low cost, and excellent cost-effectiveness, making it adaptable to environments such as online testing and more.
|
Model |
Detector pixels |
Detector cooling |
Features |
|
ATP3330 |
2048 |
NO |
Standard model |
|
ATP3330-LVF |
2048 |
NO |
Built-in LVF anti-multi-order diffraction filter |
|
ATP3334 |
4096 |
NO |
4096 pixel CCD detector |
|
ATP3334-LVF |
4096 |
NO |
Built-in LVF anti-multi-order diffraction filter |
Test spectrum:
ATP3334 test spectrum; 460-720nm, optical resolution 0.133nm
Applications
- LIBS, plasma luminescence detection;
- Raman spectroscopy detection;
- Wavelength monitoring (laser, LED, etc.);
- Water quality analyzer;
- LED sorter, color detection;
- Transmittance detection, reflectance detection;
Typical optical path of spectrometer:
When the incident light is reflected by a mirror on the surface of the object being measured, it enters the spectrometer through the reflection probe. If the light intensity is too high, a reflective integrating sphere can be used for uniform reflection so that the light intensity at any point on the inner wall of the integrating sphere is the same. If you need to test the diffuse reflection performance of the object surface, you should also use a reflective integrating sphere.
Transmittance measurement optical path
Transmittance refers to the ratio of the intensity of light to the intensity of incident light when it passes through a material. Fiber optic spectrometers can accurately measure transmittance at different wavelengths by comparing the changes in light intensity before and after the lens. The transmittance curve reflects the ability of an optical lens to transmit light of different wavelengths and is one of the important indicators for evaluating the optical performance of a lens.
Liquid absorbance measurement optical path
Absorbance Measurement Principle:
According to Beer-Lambert's Law, chemical components in a solution or gas absorb light quantitatively. Absorbance is directly proportional to the molar absorption coefficient, path length, and concentration of the medium.
Using array detectors for UV/Visible/Near-Infrared spectral analysis is ideal for detecting large quantities of samples in industrial production. Absorbance measurement can be conducted by using different experimental setups and spectrometers with various wavelength ranges (e.g., immersion fiber probes, flow cells, or glass cuvettes), combined with light sources (such as deuterium lamps or deuterium-tungsten integrated light sources).
Spectrometers: Key to Food Safety and Quality Control
Spectroscopy-Driven In-line Process Optimization in Smart Manufacturing
Related Article