
Spectral Analysis: Revolutionizing Rosewood Identification
2025-05-29
01 The "Real vs. Fake" Dilemma in Rosewood Markets

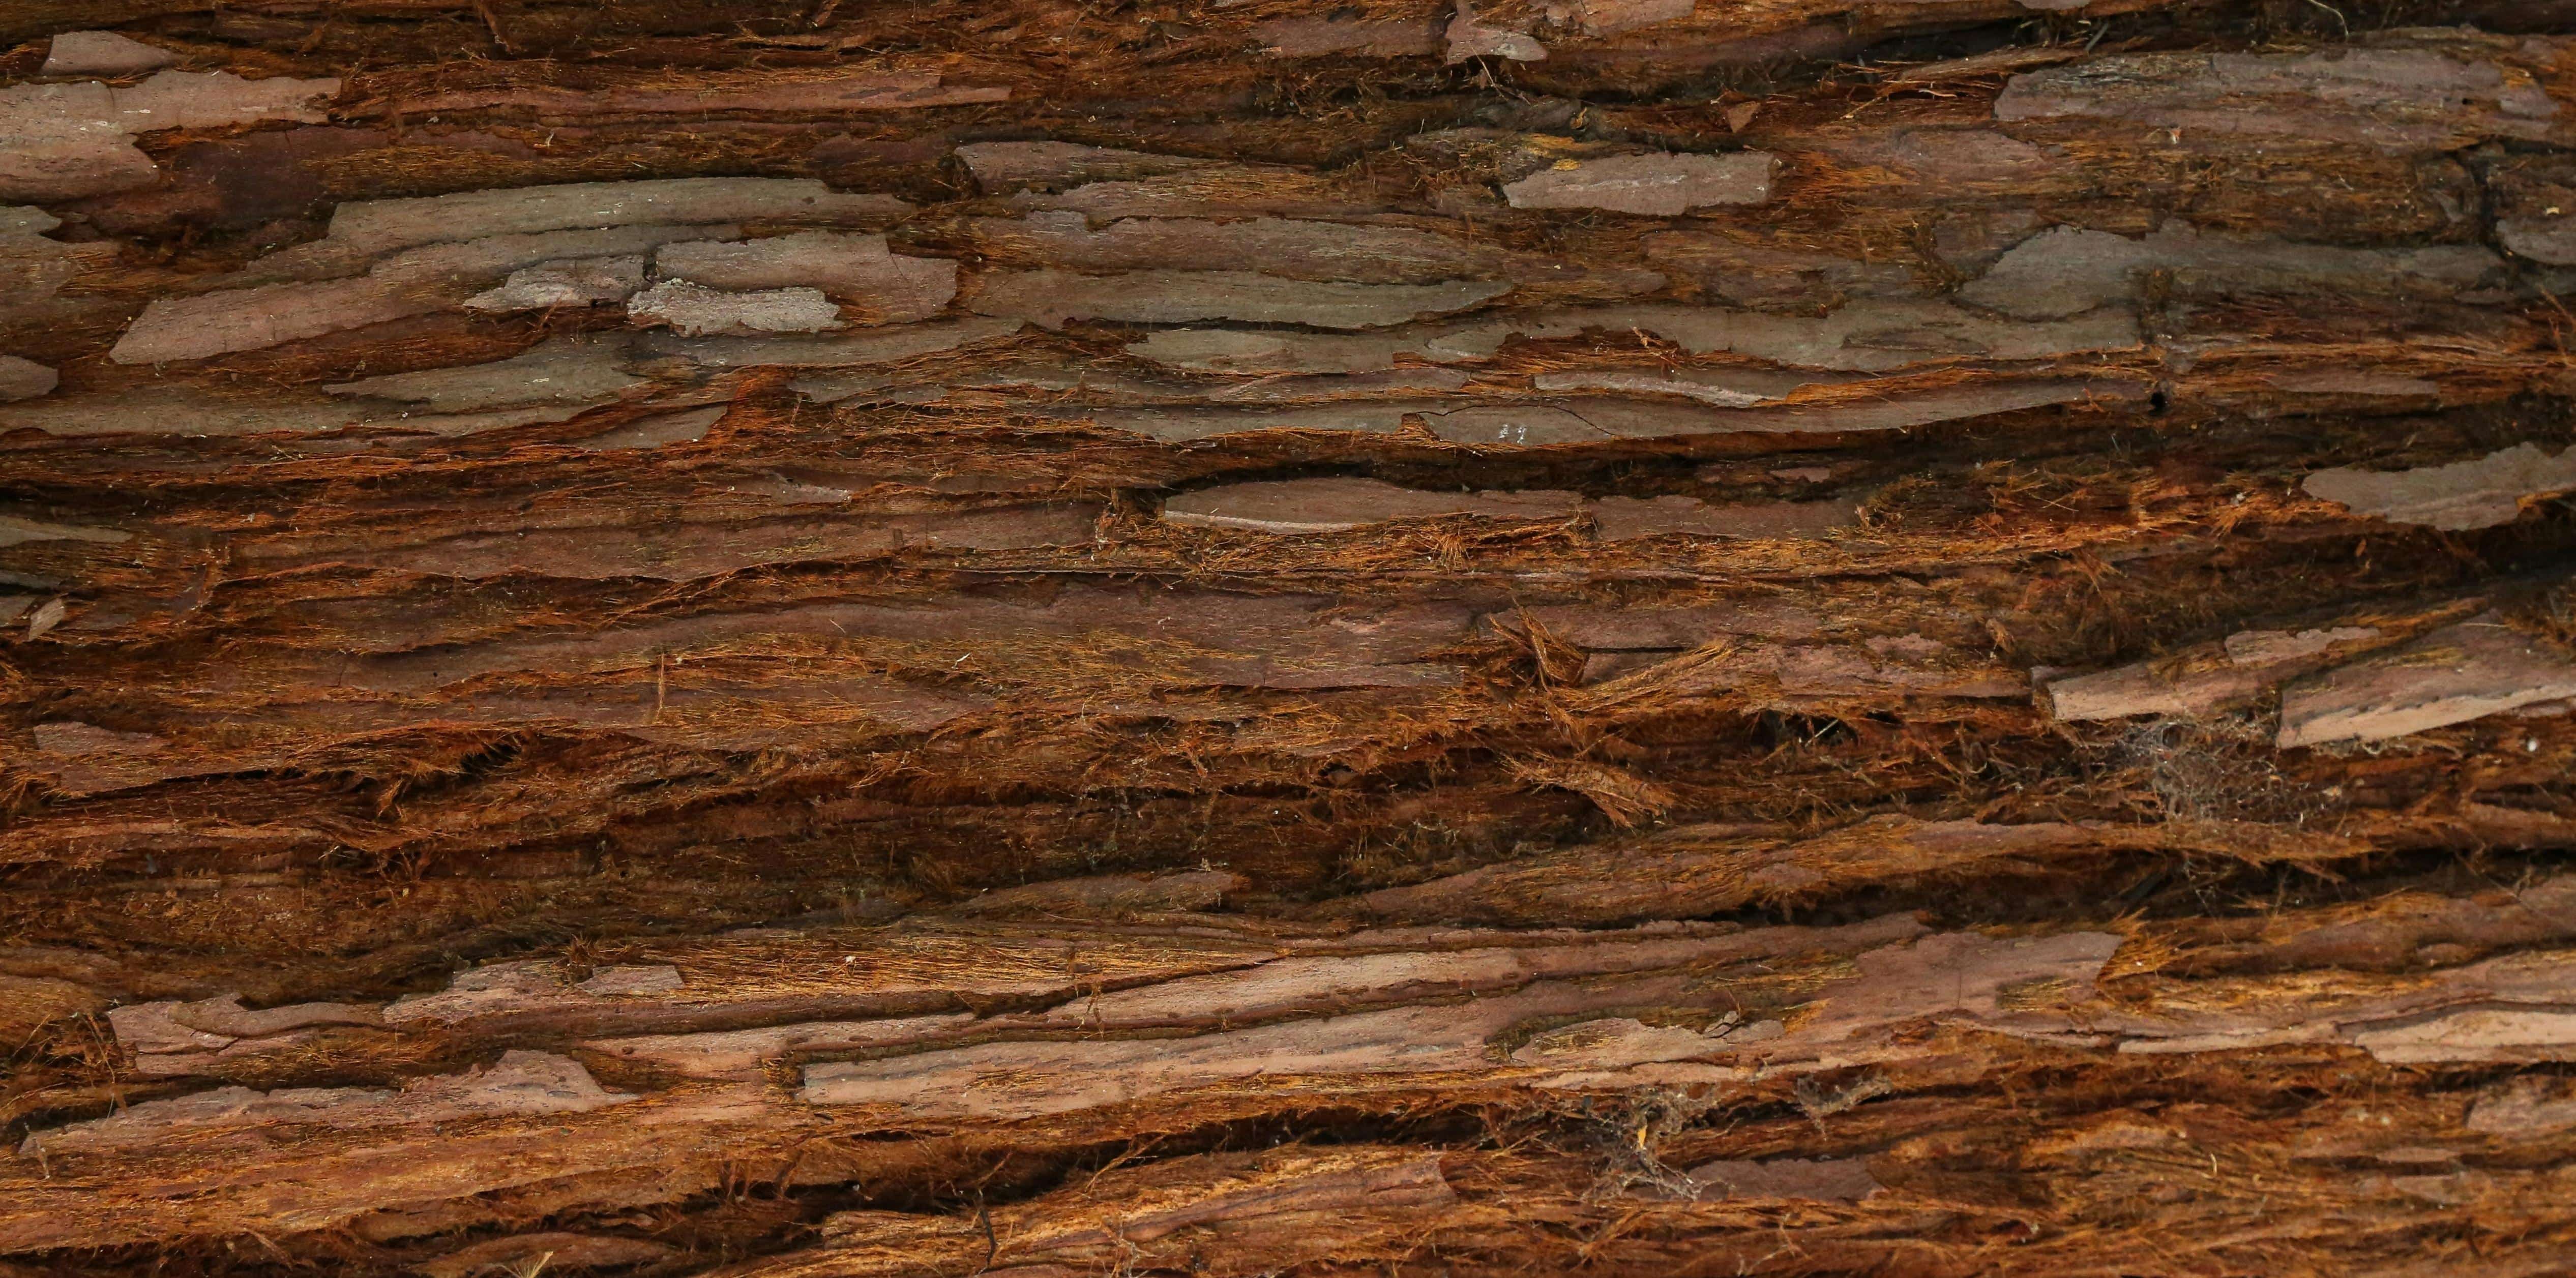
Fig.1 Rosewood Timber
Red sandalwood (Pterocarpus santalinus), revered as the "King of Woods," commands premium value in antique and furniture markets due to its centuries-long growth cycle. Genuine specimens feature:
-
Deep crimson hue with intricate grain patterns
-
Jade-like texture and subtle fragrance
-
Dense, old-growth timber structure
Counterfeit Challenges:
-
African padauk (Pterocarpus tinctorius): Near-identical visual characteristics
-
Chemically treated common woods: Stained and scented imitations
-
Evolving forgery techniques that bypass visual inspection
02 Spectrometers: The "Hawkeye" of Technology
Core Working Principle:
-
Light Interaction: A broadband light source illuminates the sample.
-
Signal Capture: Reflected/transmitted light carries molecular fingerprint data.
-
Spectral Dispersion: A diffraction grating separates light into component wavelengths (400–2500 nm range).
-
Detection: InGaAs/Si detectors convert photons to digital spectra.
Key Advantages:
-
Speed: 3-second measurement per sample
-
Non-destructive: Zero physical damage to specimens
-
Precision: 0.1 nm resolution detects regional origin variations
-
Portability: Field-deployable units
03 Case Study: Distinguishing Sandalwood from Padauk
Experimental Design
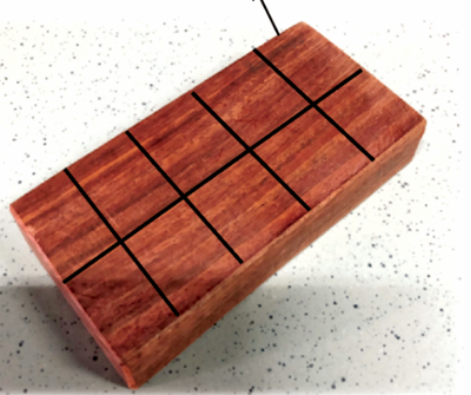
Fig. 2 Sample Measurement Zones
-
Samples: 30 P. santalinus (India/Sri Lanka) + 30 P. tinctorius (Congo/Zambia)
-
Preparation: 1mm heartwood sections, sanded to optical grad
-
Instrument: High-resolution fiber optic spectrometer (400–2500 nm range)
Methodology
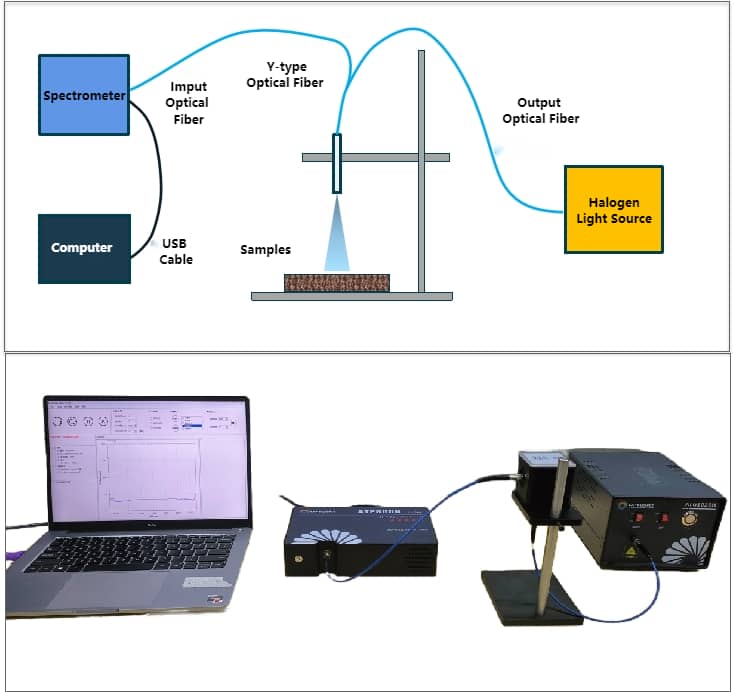
Fig. 3 Measurement Setup
-
Spectral acquisition at 50 ms integration time
-
Triplicate measurements per sample
-
Data preprocessing: Savitzky-Golay smoothing, MSC normalization
-
Chemometric modeling:
-
PLS-DA (Partial Least Squares Discriminant Analysis)
-
BPNN (Backpropagation Neural Network) with 24 input nodes and 13 hidden neurons
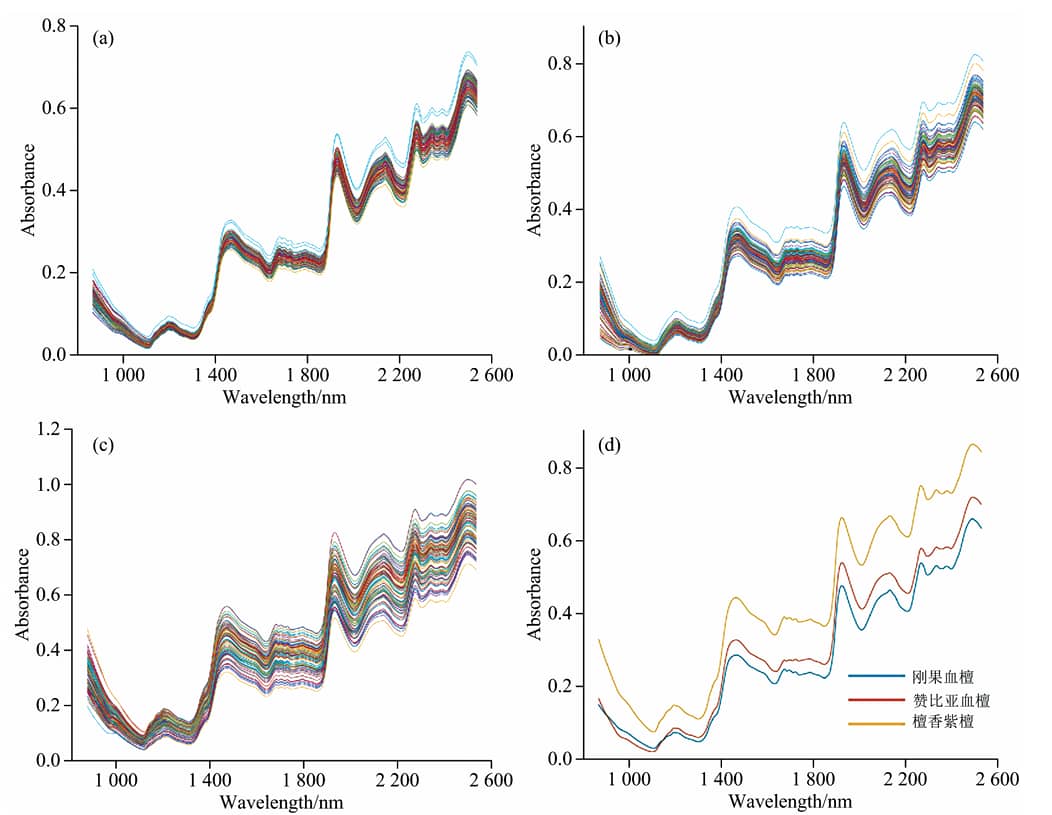
Fig. 4 Characteristic NIR Spectra
(a) Congo Padauk (b) Zambian Padauk (c) Red Sandalwood (d) Comparative spectra
Results
Key Insight: The 866-2533 nm spectral region contains critical biomarkers for species differentiation.
|
Model |
P. santalinus Accuracy |
P. tinctorius Accuracy |
|
PLS-DA |
85% |
82% |
|
BPNN |
96.43% |
94% |
04 Applications & Challenges
Market Opportunities
-
Authentication Services: On-site verification for auction houses and dealers
-
Supply Chain Control: Mill entry-point screening
-
Research: Correlation between spectral signatures and growth conditions
Technical Barriers
1. Spectral Variability:
-
Batch-to-batch differences (accuracy drift: ≤5%)
-
Moisture/temperature sensitivity
2. Operational Complexity:
-
Requires trained technicians
-
Calibration maintenance challenges
3. Cost Constraints:
-
Entry-level systems: $12,000–$18,000
-
Limited SME accessibility
Innovation Roadmap
-
Database Expansion: Global wood spectral library development
-
AI Integration: Deep learning for regional origin tracing
-
Cost Reduction: Miniaturized OEM modules (<$3,000)
Conclusion
Fiber optic spectroscopy enables 95%+ accuracy in rosewood authentication – a quantum leap over traditional methods (≤70% accuracy). As Optosky advances portable NIR systems like the ATP3030, this technology promises to:
-
Eliminate $2.3B annual global timber fraud
-
Preserve endangered species through traceability
-
Empower collectors with scientific verification
Spectroscopic Analysis in Rare Earth Element Detection
Spectroscopic Methods for Quality Monitoring in High-Oil Soybean Storage
Related Article

The ATP7810 is a wide-band, high-resolution infrared grating spectrometer covering up to 0.9–5 μm. Featuring a motorized rotating grating, multiple detector options (InGaAs/MCT), and flexible interfaces (SMA905 or free space, USB/UART control), it delivers high SNR and stability for absorption/reflection/transmission spectroscopy, laser wavelength testing, and fiber optic sensing.
New Product Recommendation | ATP7810 Ultra-Wide Range Infrared Spectrometer Series

This study uses the ATP5200P UV-Vis spectrometer to investigate xanthate adsorption on chalcopyrite surfaces. By analyzing absorbance at 300 nm under controlled pH and temperature, the method optimizes flotation conditions for copper recovery, enabling real-time, sensitive detection of adsorption mechanisms in non-ferrous mineral processing.
Using the ATP5200P Spectrometer to Unravel Xanthate Adsorption and Separation Mechanisms
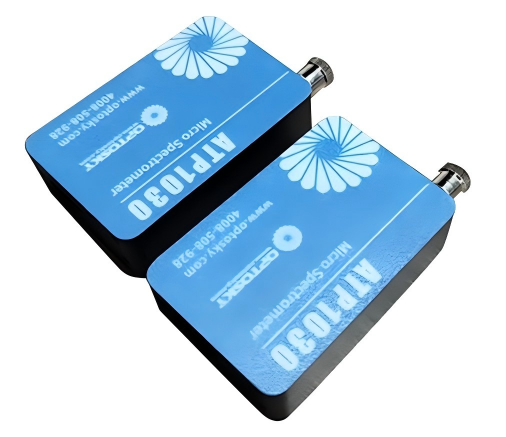
ATP1030 is an ultra‑compact, high‑resolution spectrometer covering 190–1100 nm. With a 1024‑pixel CMOS detector, adjustable integration time down to 1 ms, and USB‑powered design, it delivers reliable performance for applications like online water analysis, color measurement, handheld instruments, and Raman spectroscopy.
Product Recommendation | ATP1030 mini spectrometer Spectrometer

Vis-NIR transmission spectroscopy enables non-destructive identification of infertile duck eggs before incubation, achieving >95% accuracy. By detecting spectral fingerprints (e.g., 836 nm peak for fertile eggs), this method reduces energy waste and improves hatch rates, offering a low-cost, high-throughput solution for modern poultry farming.
Application case | How Spectral Technology is Transforming Duck Egg Farming