

qr Code Url

Scan qrcode to view mobile website

    OPTOSKY /NEWS /Fieldspec Blog /What is the feature of field spectrum? /

    What is the feature of field spectrum?

    2020-08-18

    In the visible and infrared bands, the radiation of surface objects themselves is almost zero. The spectrum emitted by ground objects is mainly reflected solar radiation. After solar radiation reaches the ground, in addition to reflection, the object also absorbs electromagnetic radiation.

    The rest of the electromagnetic radiation that is not absorbed and reflected is the cast part: Solar radiation energy reaching the ground = reflected energy + absorbed energy + transmitted energy.

    Generally speaking, most objects do not have the ability to transmit visible light. Some objects, such as water, have a strong ability to transmit electromagnetic waves of a certain wavelength, especially for the blue-green light band of 0.45-0.56um.

    The transmission depth of general water bodies can reach 10-20m, and the depth of clear water bodies can reach 100m.

    For surface objects that generally cannot transmit visible light, electromagnetic waves with a wavelength of 5 cm have the ability to transmit. For example, the transmission ability of ultra-long wave is very strong, and it can penetrate the ground rock and soil.

    Different features have different reflectance spectrum curves:

    The 0.4-0.5um band can distinguish snow from other ground objects; The 0.5-0.6um band can separate deserts from wheat and wet areas; The 0.7-0.9um band can separate wheat and wet areas.

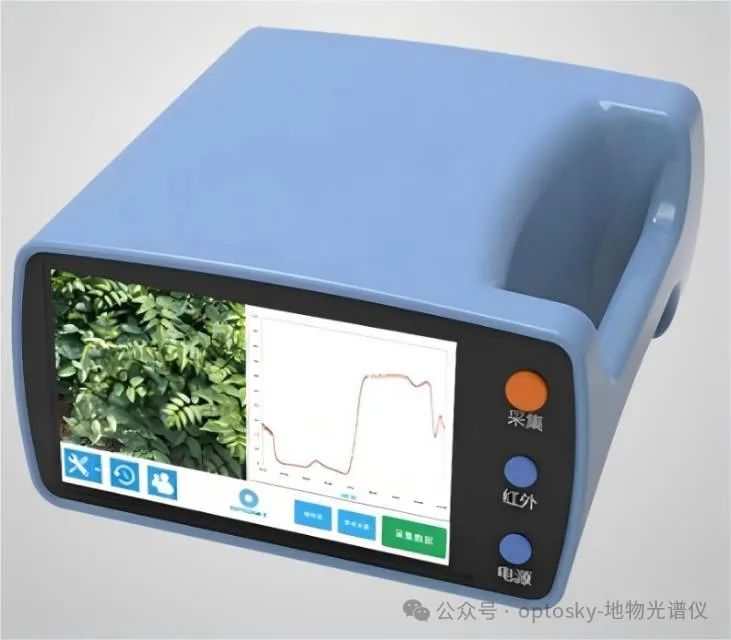
    The visible light band has a reflection peak at 0.4-0.76um, at about 0.55um (green), there are two absorption bands at both sides of 0.45um (blue) and 0.67um (red); There is a steep reflection slope at 0.7-0.8um in the near-infrared band, and a peak near 1.1um, forming a unique characteristic of vegetation; The mid-infrared band 1.3-2.5um is affected by the water content of plants, the absorption rate is greatly increased, and the reflectance is greatly reduced.

    In the natural state, the reflectivity of the soil surface has no obvious peaks and valleys. Generally speaking, the finer the soil, the higher the reflectivity. The higher the organic matter and water content, the lower the reflectivity. Soil type and fertility also affect the soil reflectivity. However, due to its smoother spectral curve, the difference in soil brightness is not obvious in the remote sensing effects of different spectral bands.

    The water reflectance is low, as small as 10%, which is much lower than most other features. Water has strong reflection in the blue and green bands, and strong absorption in other visible light bands. Pure water is the highest in the blue band, and the reflectivity decreases as the wavelength increases. The reflectivity in the near-infrared band is 0; the peak reflectivity of chlorophyll-containing clear water is in the green region, and the more chlorophyll in the water, the higher the peak. This feature can monitor and estimate the concentration of algae. The reflectivity of muddy water and silt water is higher than the above conditions, and the peak appears in the yellow-red area.

    The rock reflection curve has no uniform characteristics, and mineral composition, mineral content, weathering degree, water content, particle size, surface smoothness, and color have an effect. For example: light-colored minerals and dark-colored minerals have a greater impact on it, light-colored minerals have high reflectivity, and dark-colored minerals have low reflectivity. In nature, rocks are mostly covered by plants and soil, so they are also related to their covering.

    Share:

    What is field spectrum?

    Why to choose ATP9110 Handheld Field Spectroradiometer?

    Related Article

    image
    This study distinguishes natural emeralds from synthetic ones by analyzing their UV-visible-NIR spectral features. Key findings reveal distinct Fe-related and water absorption peaks in natural emeralds, enabling accurate identification.
    Using Field Spectroradiometer for Synthetic Emerald Identification
    2024-11-25
    image
    This article investigates using a Field Spectroradiometer to identify chlorophyll concentration in rice leaves. The study highlights the effectiveness of hyperspectral technology for assessing chlorophyll levels in rice leaves using field-based spectral data.
    Using Field Spectroradiometer to Identify Rice Chlorophyll Concentration
    2024-10-24
    image
    This post introduces the application of field spectrometry technology in predicting and monitoring water pollution. By examining the relationship between water body reflectance spectra and water quality indicators, it demonstrates how spectral technology can be used for large-scale water quality monitoring and dynamic tracking of water pollution development.
    Water Quality Monitoring
    2024-09-20
    image
    This post explores the importance of real-time measurement of moisture content in forest litter using infrared spectroscopy. It discusses how different moisture levels influence the infrared absorption spectrum of vegetation and explains how spectral data can be used to build predictive models for forest fire prevention.
    Forest Fire Prevent
    2024-09-20


    Whatsapp :15345924185

    EMAIL: sales@optosky.net

    ADDRESS: No. 7, Tianjing International Intelligent Industrial Park, Tianxin District, Changsha City, Hunan Province, China

    Home
    Products

    About

    Contact

    Download

    SiteMap

    Powered by Optosky

    Optosky©2024

    (135891)
    0
    Service

    WhatsApp
    15345924185
    Wechat
    15345924185
    Phone
    +86-15345924185
    Email
    sales@optosky.net
    Inquiry
    Inquiry
    Top