
Applications | Nutritional Content Analysis of Rice Seeds Based on NIR Spectroscopy
2025-11-04

The nutritional quality of rice seeds directly impacts crop yield and agricultural product value, with key components such as protein, fat, and starch serving as essential indicators for quality assessment. Traditional chemical detection methods are cumbersome, time-consuming, labor-intensive, and environmentally unfriendly.
Optosky's near-infrared (NIR) spectrometer, combined with advanced spectral analysis technology, provides a complete solution for the rapid, non-destructive, and accurate analysis of rice seed nutritional content.
01 NIR Spectroscopy and Rice Seed Nutritional Analysis
Near-infrared spectroscopy (NIR) is a rapid, non-destructive analytical technique based on molecular vibrations. By measuring a sample's absorption and scattering characteristics in the NIR range (~700–2500 nm), it captures chemical composition information. This technique is particularly suitable for analyzing organic compounds containing chemical bonds such as C–H, O–H, and N–H, which correspond to the characteristic absorption features of protein, fat, and starch in rice seeds.
In recent published research, NIR spectroscopy was used to collect spectral data from six different rice seed varieties. Combined with chemometric algorithms, it successfully achieved accurate prediction of protein, fat, and starch content, with the best model reaching a prediction accuracy of R² = 0.971.
02 Technical Advantages of Optosky NIR Spectrometers
Optosky NIR spectrometers are specially optimized for agricultural detection applications and offer the following core technical features:
Excellent Optical Performance
-
Broad spectral range: Covers 900–2500 nm, fully capturing nutritional component characteristic spectra
-
High signal-to-noise ratio: >1000:1 ensures accurate detection of weak signals
-
Superior resolution: High optical resolution clearly distinguishes adjacent characteristic peaks
-
Stable light source system: High-performance halogen tungsten lamp provides stable and uniform illumination
Professional System Design
-
Transmission detection mode: Penetrates the rice seed interior to obtain comprehensive component information
-
Dedicated sampling accessories: Optimized sample chamber ensures consistency and repeatability
-
Intelligent temperature control system: Maintains stable detector temperature, reducing environmental interference
-
Modular structure: Supports customized configurations to meet diverse application needs
03 NIR Spectral Analysis and Modeling Process for Rice Seeds
3.1 Spectral Collection and Preprocessing
The study used transmission mode for spectral collection, effectively avoiding interference from the seed coat surface reflection and obtaining true internal composition information. Preprocessing methods such as Gaussian denoising, first-derivative processing, and multiplicative scatter correction (MSC) significantly improved spectral quality by:
-
Eliminating baseline drift and background noise
-
Enhancing resolution of characteristic spectral peaks
-
Correcting effects of uneven particle size and distribution
3.2 Characteristic Wavelength Selection
The successive projections algorithm (SPA) was used to screen key characteristic wavelengths from the full spectrum, reducing variable dimensions by over 70% while maintaining prediction accuracy and significantly improving model efficiency.
3.3 Prediction Model Construction
Multiple modeling methods were compared, including partial least squares (PLS), orthogonal partial least squares (OPLS), and artificial neural networks (ANN). The OPLS model demonstrated the best performance.
|
Nutritional Components
|
Coefficient of determination R2
|
Cross-validation Q2
|
RMSE
|
RMSECV
|
|
Fat
|
0.971
|
0.926
|
0.175
|
0.186
|
|
Starch
|
0.956
|
0.907
|
0.159
|
0.146
|
|
Protein
|
0.967
|
0.936
|
0.164
|
0.156
|
04 Technical Advantages and Value
4.1 Revolutionary Improvement in Detection Efficiency
-
Rapid analysis: Each sample takes only seconds, dozens of times faster than traditional methods
-
Non-destructive testing: No sample preparation required, preserving seed viability and commercial value
-
Multi-component synchronization: Obtain protein, fat, starch, and other component contents in a single scan
4.2 Key Support for Precision Agriculture
-
Variety breeding: Rapid screening of rice varieties with high nutritional value
-
Quality grading: Scientific and accurate grading of rice seed quality
-
Process monitoring: Tracking changes in nutritional components during storage
4.3 Significant Economic Benefits
-
Cost reduction: Less chemical reagent usage and lower labor costs
-
Value enhancement: Achieving premium pricing through quality grading
-
Facilitating trade: Providing reliable quality benchmarks for rice seed transactions
05 Application Prospects
The successful application of Optosky NIR spectrometers in rice seed nutritional analysis opens new pathways for quality detection in grain crops. The technology can be further extended to:
-
Other grain testing: Quality analysis of wheat, corn, soybeans, and other crops
-
Seed vitality assessment: Predicting germination rates based on nutritional content
-
Agricultural product processing: Raw material inspection and product quality control
-
Research and education: Analytical studies in agricultural universities and research institutions
Optosky IR Series Products:
IR2300 NIR Grain Analyzer
IR2000 AT-Line NIR Analyzer
Reference
-
Kong, H.; Wang, J.; Lin, G.; Chen, J.; Xie, Z. Analysis of Nutritional Content in Rice Seeds Based on Near-Infrared Spectroscopy. Photonics 2025, 12, 481. https://doi.org/10.3390/photonics12050481.
New Product Launch | ATF4500 3D Fluorescence Spectrophotometer
UV-VIS Spectroscopy: Decoding the Optimal Harvest Time for Dai Medicine Alstonia Scholaris Leaves
Related Article
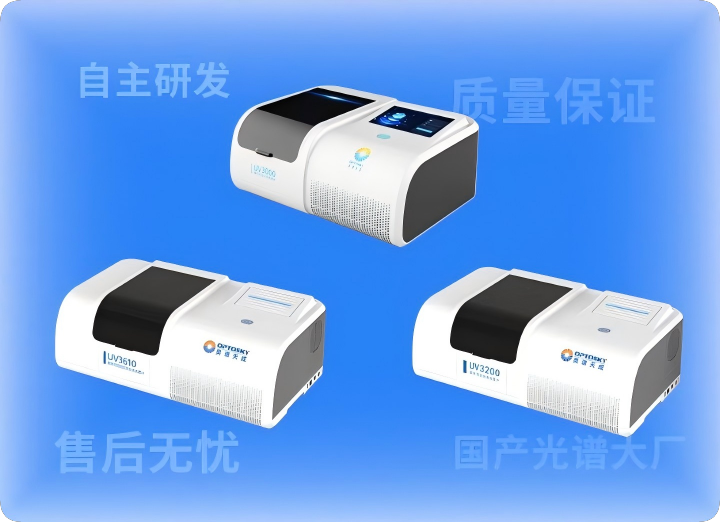
Optosky's spectrophotometer series includes the UV3000 (dual‑beam, 6‑position cell holder, touchscreen/pulsed xenon options), UV3200 (double monochromator, low stray light, high sensitivity), and UV3610 (UV‑Vis‑NIR). Designed for teaching, pharmaceuticals, water quality, and advanced research – stable, accurate, and efficient.
Racing with Light, Multi-Product Launch | Stable · Accurate · Efficient – Spectrophotometer Series
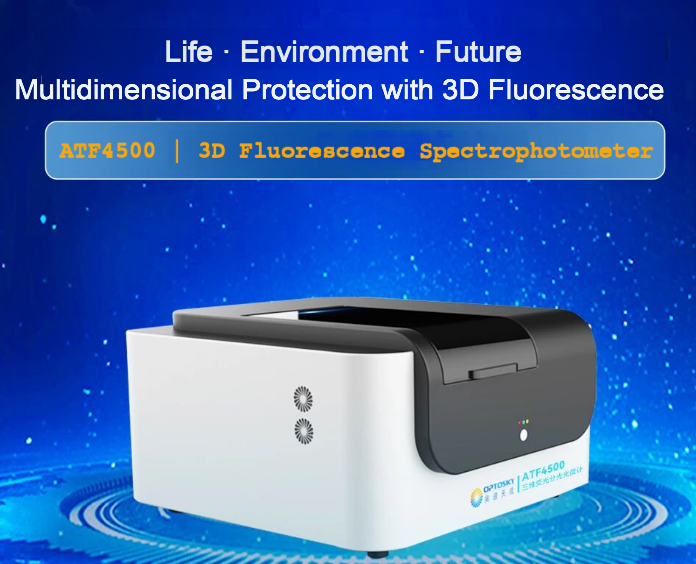
The Optosky ATF4500 is a high-performance 3D fluorescence spectrophotometer featuring a 150W xenon lamp, dual monochromators, 0.8nm resolution, and a high-sensitivity PMT detector (200–900nm). It enables fast, multidimensional fluorescence analysis for life sciences, environmental monitoring, food safety, and materials research.
New Product Launch | ATF4500 3D Fluorescence Spectrophotometer
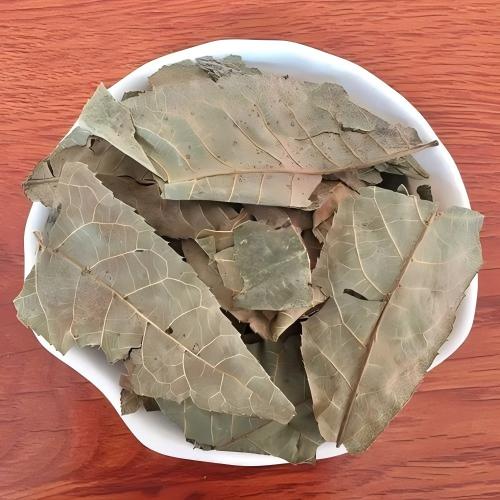
UV-VIS spectroscopy provides an efficient, non-destructive solution for determining the optimal harvest time of Alstonia scholaris leaves used in Dai medicine
UV-VIS Spectroscopy: Decoding the Optimal Harvest Time for Dai Medicine Alstonia Scholaris Leaves
The UV-Vis spectrophotometer is an analytical instrument based on the Beer-Lambert law. It analyzes substances by measuring their absorption of ultraviolet-visible radiation. Widely used in metallurgy, geology, environmental protection, agriculture, and scientific research, the instrument consists of a light source, monochromator, absorption cell, detector, and signal processor.
Product Recommendation: UV3000 UV-Vis Spectrophotometer