
Research on Quantitative Inversion of Wheat Chlorophyll Content and Yield Based on Multispectral Imagery
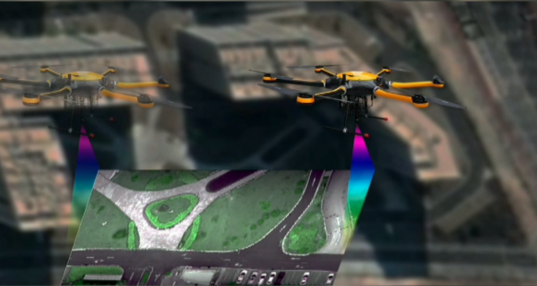
Wheat, one of the three major staple crops in the world, serves as a primary food source for 40% of the global population. As a major crop in China, wheat is grown extensively. Monitoring the growth conditions of specialized wheat varieties is crucial for the country's economic development. Therefore, efficient and nondestructive monitoring of wheat growth and timely, accurate forecasting of wheat yield are of utmost importance.
II. Technical Approach and Main Content
Optosky employs domestically produced multispectral imaging systems, studying ten different wheat varieties. On one hand, using a multispectral camera, images of wheat at early and late flowering stages are collected. Vegetation indices derived from these images are used to construct chlorophyll inversion models for early and late flowering stages under different cameras. On the other hand, highresolution images of wheat during the grainfilling period are obtained using a drone equipped with a multispectral camera. Based on color features and vegetation indices, inversion models for chlorophyll and wheat yield during the grainfilling period are developed.
Required Content:
(1)Multispectral Image Preprocessing: To ensure consistency in subsequent image processing, exposure time, aperture, and other parameters must be set in advance when capturing visible light and multispectral images of wheat fields. After image acquisition, preprocessing steps such as radiometric calibration, image stitching, orthorectification, geometric correction, and image cropping are required for the quantitative use of the data in later experiments.
(2)Chlorophyll Content Inversion Based on Visible Light and Multispectral Images: With ten different wheat varieties as research subjects, visible light and multispectral cameras are used to capture images of wheat at early and late flowering stages. The correlation analysis between measured chlorophyll content and various vegetation indices from these images helps select the most effective vegetation index for chlorophyll content inversion. Finally, chlorophyll content inversion models for early and late flowering stages are developed based on the selected vegetation indices.
(3)Chlorophyll and Yield Inversion Based on HighResolution Drone Images: Highresolution images of wheat during the grainfilling period are captured using a multispectral camera mounted on a drone. The Partial Least Squares (PLS) algorithm is employed to select multiple features highly correlated with measured parameters as independent variables, creating inversion models for chlorophyll content and wheat yield during the grainfilling period.
(4)Monthly Drone Flights with Multispectral Camera: To provide a reference for precise monitoring, the multispectral cameraequipped drone will fly once a month, collecting longterm sequential monitoring image data.
Multispectral Image Preprocessing
Due to various factors such as sensor characteristics and weather conditions, errors in data acquisition are inevitable. These errors not only degrade image quality but also affect the accuracy of subsequent analysis. Therefore, preprocessing steps are required before performing multispectral remote sensing image analysis. The preprocessing workflow for image data is shown in Figure 2.
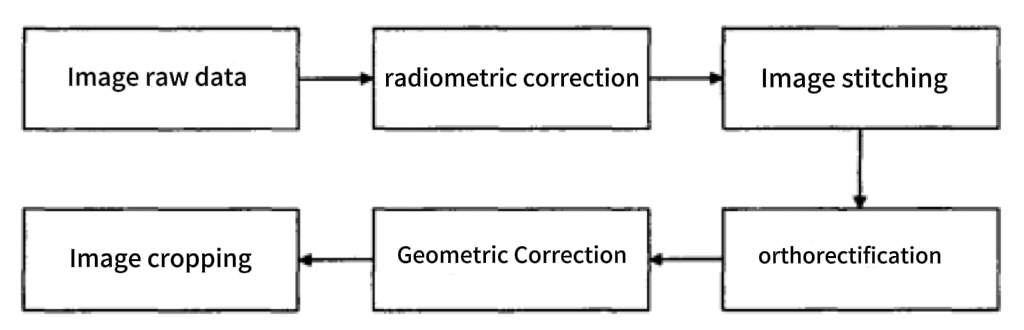
(1)Radiometric Calibration: During drone flights, image distortion in the spectral dimension occurs due to varying light and weather conditions. To ensure smooth image stitching, radiometric calibration is necessary. Visible light image radiometric calibration uses the pseudostandard reference method—whiteboard method—to convert image values to reflectance values, thus accurately reflecting surface reflectance and meeting experimental requirements. Radiometric calibration for multispectral images is performed using the data processing software provided with the Optosky multispectral imaging system.
(2)Orthorectification:While capturing images, drone body movements such as shaking and tilting, and lens distortion due to changes in flight posture, necessitate orthorectification. Orthorectification corrects image distortions by transforming each pixel of the original image to the coordinate system of the corrected image. The processing flow is shown in Figure 3.
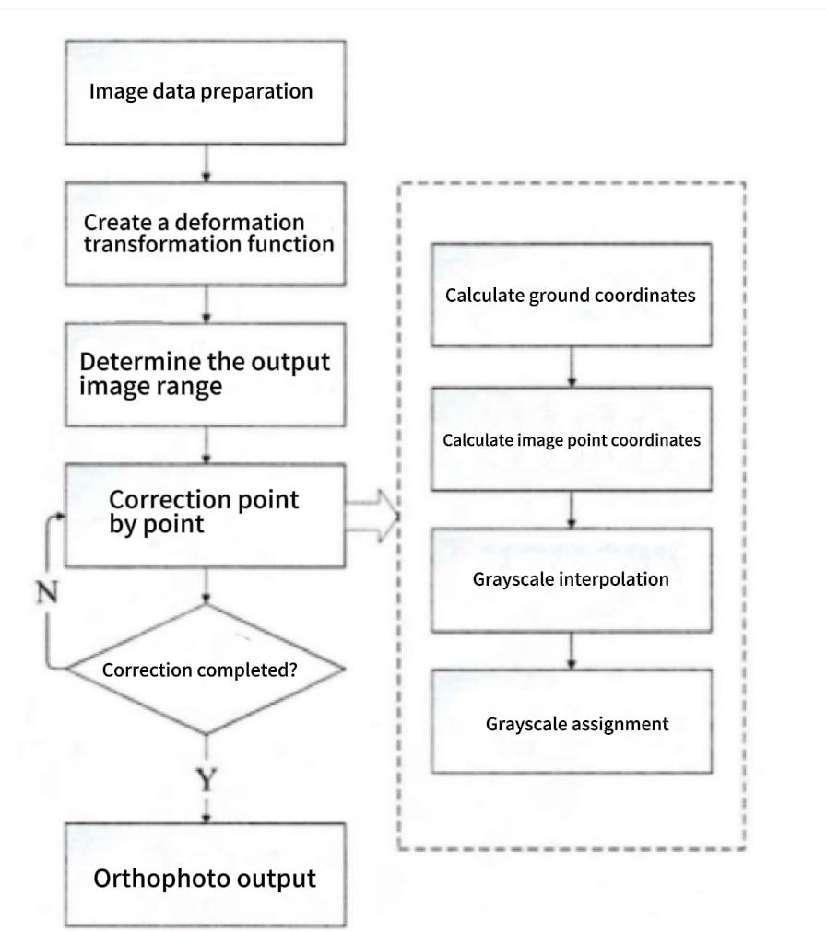
Figure 3. Orthorectification Processing Workflow for Drone Images
(3) Geometric Correction: Due to limited accuracy of the drone's positioning system and external factors such as air currents, wind speed, and direction, there may be discrepancies between the geographical coordinates of the captured images and actual coordinates. Therefore, geometric correction is performed using highprecision ground control point coordinates.
In practical problems, it is often necessary to study the interdependence between two sets of multiple related variables and predict one set (dependent variables) using another set (independent variables). Besides classical Multiple Linear Regression (MLR) and Principal Component Regression (PCR), the Partial Least Squares (PLS) regression method has been developed recently.
PLS regression offers a method for multivariate linear regression modeling, especially when there are many variables with multicollinearity and the sample size is small. The PLS regression model has advantages over traditional methods such as classical regression analysis. PLS regression combines characteristics of Principal Component Analysis, Canonical Correlation Analysis, and Linear Regression Analysis, providing a more reasonable regression model and additional information similar to PCA and CCA.
Table 1. Formulas for Calculating Vegetation Indices
|
Abbreviation |
Vegetation Index Names |
Calculation formula |
|
GI |
Greeness Index |
R544/R677 |
|
SIPI |
StructureInsensitive Vegetation Index |
(R800R445)/(R800R680) |
|
NPCI |
Normalized Total Chlorophyll Index |
(R680R430)/(R680+R430) |
|
MSR |
Modified Simple Vegetation Index |
(R800/R6701)/(R800/R670+1)^1/2 |
|
NRI |
Nitrogen Reflectance Index |
(R570R670)/(R570+R670) |
|
PRI |
Photochemical Reflectance Index |
(R570R531)/(R570+R531) |
|
TCAR |
Conversion Chlorophyll Index |
3*[(R700R670)0.2*(R700R550)*(R700/R670)] |
|
PSRI |
Vegetation Decay Index |
(R800R445)/(R800R680) |
|
PHRI |
Physiological Reflectance Index |
(R550R531)/(R550+R531) |
|
ARI |
Anthocyanin Reflectance Index |
(R550)^(1)(R700)^(1) |
|
TVI |
Triangular Vegetation Index |
0.5*[120*(R750R550)200*(R670R550)] |
|
RVSI |
Red Edge Vegetation Stress Index |
[(R712+R752)/2]R732 |
|
MCAR |
Adjusted Chlorophyll Absorption Ratio Index |
[(R701R671)0.2*(R701R549)]/(R701/R671) |
|
AR VI |
Atmospheric Resistant Vegetation Index |
R800(2*R700R436)]/[R800+2*R700R436] |
|
DVI |
Difference Vegetation Index |
R800R700 |
|
EVI |
Enhanced Vegetation Index |
2*(R800R700)(R800+6*R7007.5*R436+1) |
|
GNDVI |
Greeness Normalized Vegetation Index |
(R546R700)/(R546+R700) |
|
LMI |
Leaf Moisture Index |
R1650/R830 |
|
OSAVI |
Optimized Soil Adjustment Vegetation Index |
[(R800R700)/(R800+R700+0.16)]*(1+0.16) |
|
NDVI |
Normalized Difference Vegetation Index |
(R800R700)/(R800+R700) |
|
RVI |
Ratio Vegetation Index |
R800/R700 |
|
SAVI |
Soil Adjustment Vegetation Index |
1.5*(R800R700)/(R800+R700+0.5) |
|
SLAVI |
Special Leaf Area Vegetation Index |
R800/(R700+R800) |
|
VAR |
Visible Light Atmospheric Resistance Index |
(R546R700)/(R546+R700R436) |
|
YI |
Yellow Index |
(R5802*R630+R680)/2500 |
|
WBI |
Water Band Index |
R950/R900 |
4.1 Multispectral Drone Flight Services
Multispectral imaging refers to the spectral detection technology that can simultaneously capture multiple spectral bands (usually three or more) and extends beyond visible light to infrared and ultraviolet light. This is typically achieved through various filters or beam splitters combined with digital image sensors, allowing them to simultaneously receive light signals radiated or reflected from the same target within different narrow spectral bands, thus obtaining images in several different spectral bands. Multispectral images are acquired by imaging spectrometers, which can simultaneously capture spectral characteristics and spatial image information. These systems are a significant advancement in electrooptical imaging technology. Multispectral imaging systems provide images with 3 to 20 discrete bands and have been widely used in agriculture and the food industry. From an imaging principle perspective, multispectral imaging technology divides the incoming fullband or wideband light signal into several narrowband beams, imaging them onto respective detectors to obtain images in different spectral bands. Utilizing these multispectral characteristics enables the separation of vegetation from nonvegetation and, when combined with drones, facilitates the analysis of vegetation health status.
Features of Multispectral Drone Imaging:
1. Fast Data Acquisition: Due to the relatively fewer spectral bands collected, multispectral imaging has a faster acquisition speed.
2. Lower Complexity:The limited number of bands makes multispectral imaging less complex, easier to understand and apply, and involves relatively less processing work.
3. Rich Data Volume: As the number of bands increases, the data volume grows exponentially, providing both spatial and spectral domain information, i.e., "imagespectrum integration." The spectral curves obtained by imaging spectrometers can be compared with similar groundmeasured spectral curves.
(1)Drone Setup: Assemble the drone hyperspectral equipment, set the flight height and speed, and configure the flight path spacing according to camera parameters and image overlap requirements.
(2)Camera Setup: Set the camera frame rate based on flight height and speed, and configure the integration time (exposure time) based on whiteboard measurements.
(3)Standard Reflectance Whiteboard: Place standard reflectance whiteboards in the flight path area; they must be captured in the images during acquisition.
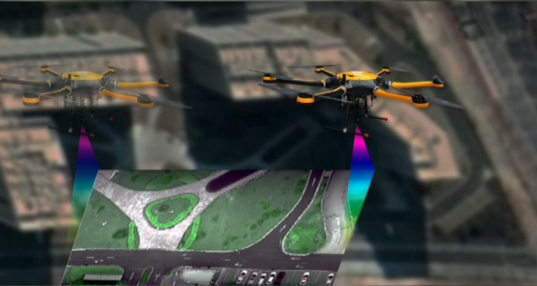
After collecting drone hyperspectral image data, the following preprocessing steps are required:
1.Wavelength Calibration: The original images do not contain wavelength information, so wavelength calibration files must be added.
2.Image Cropping: Hyperspectral imaging uses pushbroom scanning, requiring the acquired images to be cropped.
3.Registration and Stitching: Perform geographic or relative registration on the cropped images and then stitch the registered images into complete images.
4.Radiometric Calibration: The values in the original images represent reflectance intensity and must be calibrated using whiteboard reflectance values and standard reflectance to calculate the reflectance for the entire image.
5.Spectral Unmixing: The spectral data collected by the drone might be influenced by spatial resolution, leading to mixed pixels composed of different objects or vegetation. To improve accuracy, spectral unmixing operations are needed.
6.Spectral Filtering (Smoothing): The spectral information in the original images may contain noise, requiring spectral filtering before application.
Spectral Image Processing Software Interface

4.3 Ground Sample Data Collection
Optosky uses domestically produced hyperspectral imaging systems and ground spectrometers to conduct field surveys. The aim is to provide real training samples and validation samples for the classification of drone remote sensing images. The field survey primarily measures the spectral data of rice infected with neck blast. All the spectral data of neck blastinfected rice collected by the ground spectrometer are categorized by different infection levels, serving as the standard training dataset for drone hyperspectral image data processing.
4.4.1 Estimation Reliability
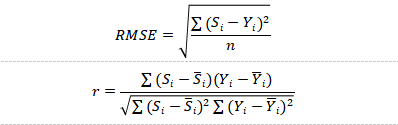
Model accuracy can be evaluated using Root Mean Square Error (RMSE) and correlation coefficient (r).
4.4.2 Factors Affecting Estimation Accuracy
Factors affecting inversion accuracy include:
1.Spectral Data: Variability in environmental conditions and manual operations during data collection can lead to differences in hyperspectral image quality. However, this is not the primary factor.
2.Measured Data: These include spectral data and quantitative measurements of leaf parameters. Instrument and manual operation factors can introduce some errors, but their impact on inversion results is minor. Timing discrepancies in measuring these two data types significantly impact the inversion model. It is crucial to avoid prolonged intervals between leaf sampling and measurement and to ensure simultaneous spectral and parameter measurements.
3.Inversion Model: The construction of the inversion model is the primary factor affecting accuracy. Variability in spectral feature selection, variable forms, and model forms can result in significant uncertainties in the inversion results.
Ore Sorting Based on Hyperspectral Imaging Principles
Application Scenarios | Hyperspectral Facial Automated Recognition
Related Article
