Academic dry stuff|Understanding UV, visible and near infrared spectrophotometer in one article
Ultraviolet-visible-near-infrared spectrophotometer (UV-Vis-NIR), whose scanning band covers the ultraviolet, visible, and near-infrared light regions, uses the absorption characteristics of material molecules to ultraviolet, visible, and near-infrared light for quantitative, qualitative analysis, is one of the common instruments in scientific research laboratories and industrial fields.
The distinction between electromagnetic waves.
1.The principle of absorption spectrum generation
UV-visible absorption spectrum is caused by the transition of valence electrons after molecules (or ions) absorb ultraviolet or visible light (usually 200-800 nm). Since energy level transitions between electrons are always accompanied by transitions between vibrational and rotational energy levels, the UV-visible spectrum exhibits a wide band.
- Electronic transitions in organic compounds
In organic compound molecules, there are σ electrons that form single bonds, π electrons that form unsaturated bonds, and lone pairs of n electrons that do not form bonds. When a molecule absorbs ultraviolet or visible light radiation, these outer electrons will transition from the ground state (bonding orbital) to the excited state (antibonding orbital). There are four main transition modes, and the order of required energy is: σ→σ *>n→σ*>π→π*>n→π*.
Schematic diagram of electronic energy levels and electronic transitions.
①σ-σ*: The absorption energy is relatively high, generally occurring in the vacuum ultraviolet region. C-C in saturated hydrocarbons belongs to this type of transition. For example, the C-C bond σ→σ* transition of ethane, λmax is 135nm;
②n-σ*: Contains heteroatom groups such as O, N, S, etc., such as -NH2 and -OH, which can produce this transition, and the molar absorption coefficient is small;
③π-π*: Groups with π electrons, such as C=C, C=O, C≡C, are generally located in the near-ultraviolet region, about 200nm, and have strong absorption intensity;
④n-π*: Unsaturated groups containing heteroatoms: groups such as C=O, C=S, -N=N- will undergo n→π*. The energy of this transition is small, and the absorption occurs in the near-ultraviolet or visible light region. It is characterized by weak intensity, small molar absorption coefficient, and the resulting absorption band is also called R band.
- Electronic transition of inorganic compounds
①Charge transfer transition:
Similar to some organic compounds, many inorganic compounds will undergo charge transfer transitions under the irradiation of electromagnetic radiation, resulting in charge transfer absorption spectra. Under radiation, the charge originally localized in the metal M orbital in the molecule is transferred to the ligand L orbital, or transferred in the opposite direction.
②Coordination field transition:
Transition elements in periods 4 and 5 of the periodic table contain 3d and 4d orbitals respectively, and lanthanide and actinide elements have 4f and 5f orbitals respectively. These orbital energies are usually degenerate (equal), but in complexes, they are split into several groups of orbitals with unequal energies due to the influence of ligands. If the orbit is not filled, the electrons will undergo transitions after absorbing light, which are called d-d transition and f-f transition respectively.
- Qualitative and quantitative analysis
- Qualitative analysis
Since various substances have different molecules, atoms and different molecular spatial structures, their absorption of light energy will not be the same. Therefore, each substance has its own unique and fixed absorption spectrum curve.
- Quantitative analysis
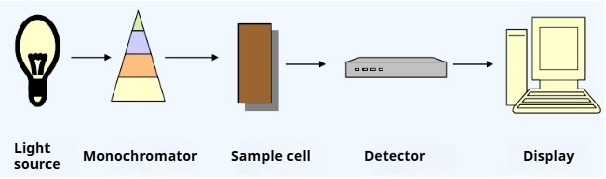
Lambert-Beer's law:
A beam of monochromatic light shines on the surface of an absorbing medium. After passing through a certain thickness of the medium, the intensity of the transmitted light will weaken because the medium absorbs part of the light energy. The greater the concentration of the absorbing medium and the greater the thickness of the medium, the more significant the weakening of the light intensity will be. The relationship is:
- Instrument composition
UV-visible-near-infrared spectrophotometer mainly consists of light source, sample cell, monochromator, detector, etc. The light source generates ultraviolet light, visible light, and near-infrared light, which passes through the sample in the sample cell. The remaining light after absorption by the sample is dispersed by the monochromator and received by the detector, thereby conducting qualitative and quantitative analysis of the sample and identifying the purity and structure of the sample. It has the advantages of high sensitivity, high resolution, wide measurement range, fast measurement speed, high analysis accuracy, small sample consumption, and non-destructive testing.
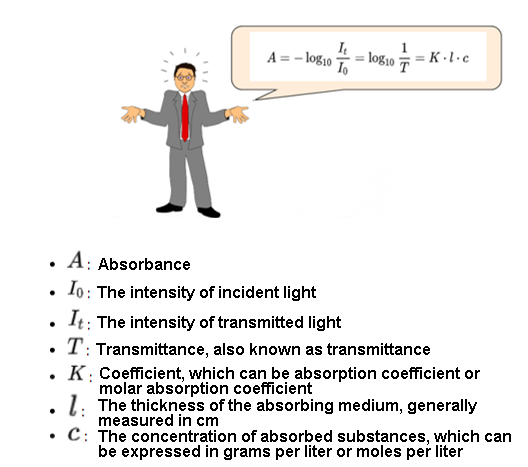
Schematic diagram of the basic structure of UV-visible-near infrared spectrophotometer.
- Application fields
According to the "2023-2028 China Ultraviolet-Visible-Near-Infrared Spectrophotometer (UV-Vis-NIR) Industry Market In-depth Research and Development Prospect Forecast Report" released by the New Sijie Industrial Research Center, UV-Visible-Near Spectrophotometer can analyze parameters such as the composition, purity, molecular structure, and content of each component of a substance. They can be used in biology, chemistry, materials science, optics, physics and other disciplines, and can be widely used in electronics, communications , petroleum, chemical industry, metallurgy, medicine, food, agriculture, geology, environmental protection and other fields.
- Product recommendation
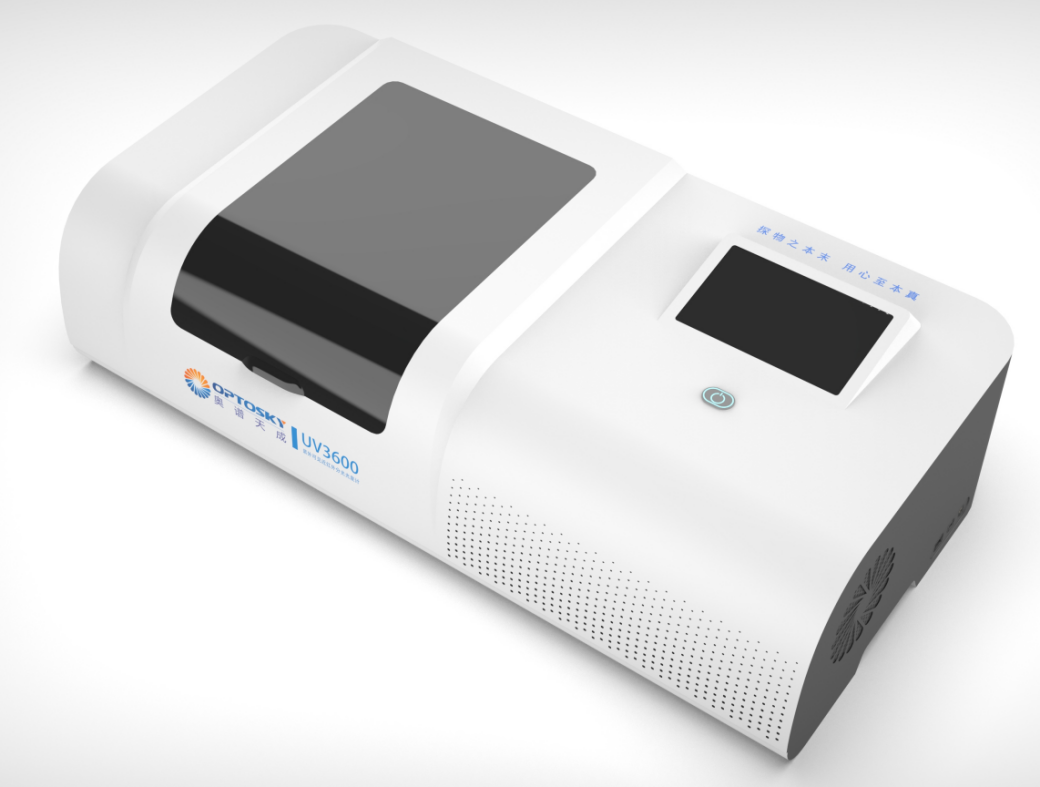
UV-Visible-Near Infrared Double Beam Spectrophotometer UV3600.
The main technical parameters
|
Model |
UV3600 |
UV3600-TP |
|
|
Wavelength range |
175~3600nm (below 185nm needs nitrogen purging) |
||
|
Optical system |
Double beam |
||
|
Number of channels in the sample cell |
6 channels, automatic switching |
||
|
Spectral bandwidth |
UV visible region: 0.01~5nm, 0.01nm interval automatic adjustment |
||
|
Near-infrared region: 0.04~20nm, automatic adjustment at intervals of 0.01nm |
|||
|
Wavelength accuracy |
Ultraviolet, visible region: ±0.08nm Near infrared region: ±0.4nm |
||
|
Wavelength repeatability |
Ultraviolet and visible region: within ±0.08nm Near infrared region: within ±0.32nm |
||
|
Transmittance accuracy |
±0.3% (0-100%) |
||
|
±0.002% (0~0.5A) |
|||
|
±0.003% (0.5A~1A) |
|||
|
Transmittance repeatability |
±0. 15% (0-100%) |
||
|
±0.001% (0~0.5A) |
|||
|
±0.0015% (0.5A~1A) |
|||
|
Stray light |
Below 0.00008%T (220nm, NaCl 10g/L solution) |
||
|
Below 0.00005%T (340nm, NaNO2) |
|||
|
Below 0.0005%T (1420nm, water) |
|||
|
Below 0.005%T (2365nm, chloroform) |
|||
|
Stability |
Less than 0.0002Abs/h (2 hours after power on, 500nm) |
||
|
Metering method |
Absorbance (Abs), Transmittance (%), Reflectance, Energy (E) |
||
|
Wavelength adjustment |
Auto scan |
||
|
Baseline straightness |
±0.004Abs (185-200nm) |
||
|
±0.001Abs (200-3000nm) |
|||
|
±0.005Abs (3000-3300nm) |
|||
|
Photometric range |
8 Abs |
||
|
Detector |
PMT, InGaAs, PbS |
||
|
Detect light source |
50W halogen lamp and deuterium lamp (socket type) |
||
|
Monitor |
None |
10. 1 inch capacitive touch screen |
|
|
Built-in storage |
None |
32GB storage, can store 1 million spectra |
|
|
External Interface |
USB2.0 |
USB2.0, LAN, WIFI |
|
|
Power supply and power consumption |
AC110~240V, 100W |
||
|
Volume |
68.5×38.5×22.5 cm3 |
||
|
Weight |
26kg |
28 kg |
|
Application of NanoBio200 ultra-trace UV spectrophotometer in the food Safety
Examples of UV-Visible Spectrometers in Absorbance Applications
Related Article