
Application Case | Fruit Forest Disaster Prevention and Control Monitoring Solution Based on UAV Hyperspectral
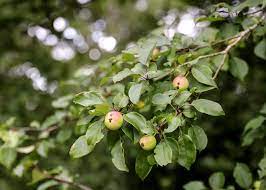
As an important part of my country's agriculture, the fruit industry ranks third in the planting industry. Its area, output and output value are second only to grains and vegetables. It plays an increasingly significant role in ensuring food supply, residents' health, ecological security, increasing farmers' income, and stimulating rural economic vitality and sustainable agricultural development and is one of the important pillar industries for rural revitalization in the new era. Pests and diseases are the main factors that affect the growth of fruit trees, reduce fruit quality, and affect the healthy development of the fruit industry. They have become one of the most fundamental and concerning disasters in fruit tree planting and production management today. There are many types and large scales of diseases and insect pests, and they often cause explosive disasters or spread again, which brings huge challenges to the effective prevention and control of fruit tree diseases and insect pests. At the same time, some weakly parasitic fungi have gradually become the main diseases of fruit trees, making prevention and control more difficult. The spread of diseases and insect pests will directly affect the quality and safety of fruit trees and fruits, and even cause consumer panic, which will have a negative impact on the development of the fruit industry. Generally, the prevention and control of diseases and insect pests of fruit trees in orchards requires regular spraying of pesticides over a large area to avoid the occurrence of pests and diseases. There is excessive use of pesticides and chemicals, which has led to serious acidification of orchard soil and increased agricultural non-point source pollution. Ultimately, it has led to high risks to the quality and safety of fruits and the fruit industry. Green and healthy development is difficult. Therefore, how to detect and effectively monitor pests and diseases early and accurately guide the timely and appropriate application of pesticides has become a focus of agricultural researchers. Traditional manual detection and monitoring are time-consuming and labor-intensive. Although they are highly accurate, they have a certain degree of subjectivity and time lag. It cannot meet the precise requirements of modern precision agriculture for positioning, timing, quantification, rapid, effective, timely and synchronous acquisition of information such as the type, location, extent and area of occurrence of pests and diseases. Therefore, real-time, rapid, accurate, and non-destructive monitoring, identification, and prevention of fruit diseases and insect pests are of great significance for increasing fruit yield, improving fruit quality, reducing fruit industry losses, promoting farmers' income increase, and revitalizing rural industries, especially the economic development of mountainous areas.
Hyperspectral remote sensing can collect one-dimensional spectral information used to describe the spectral characteristics of materials on the earth's surface and two-dimensional spatial information describing its geographical distribution. Its spectral resolution reaches the nanometer level, and a lot of spectral information at specific wavelengths for a certain plant that cannot be obtained in multispectral images is sensed. Hyperspectral remote sensing has the advantages of high resolution, strong continuity, and huge amount of information. It can obtain subtle changes in organ morphology during plant growth in real time. It shows strong potential in identifying agricultural pests and diseases, and can be used for fields, farms, orchards, etc. Provides reference for precise and efficient prevention and control of crop diseases and insect pests at different scales. By using hyperspectral sensors, hundreds of electromagnetic spectrum information of ground objects in the visible light band (0.4-0.7μm), near-infrared band (0.7-1.1μm) and short-wave infrared band (1.1-2.5μm) can be obtained. In addition, some spectral sensors can also detect continuous narrow-band spectral information better than 1 nm for ground object research and analysis. As for the level of spectral reflectance, the visible light range is determined by the absorption and reflection of pigments by vegetation, the near-infrared band is determined by the basic structure of plant cells, and the short-wave infrared range is determined by the absorption of water vapor by vegetation. Because vegetation is infected by pests and diseases in the entire wavelength range, small changes in plant organs will cause highly sensitive manifestations of leaves and morphology. This is the significance of hyperspectral applications for early diagnosis of pests and diseases and identification of different pests and diseases. This is also the reason why hyperspectral detection technology has developed rapidly and been favored in recent years. Visible light-near infrared is the range where green vegetation is most sensitive to the electromagnetic spectrum. In particular, the near infrared region and the "red edge" position play a decisive role in the early detection and diagnosis of crop disease and insect pest symptoms, and the monitoring and analysis of dynamic changes. Hyperspectral remote sensing monitoring of crop diseases and insect pests relies on the spectral response of crops affected by different stresses. In the visible light band, chlorophyll content affects the spectral characteristics of plants. When the plant is healthy and growing vigorously, the "green peak shifts to blue" when the chlorophyll content is high. When crops are infected with disease, the pigment system is destroyed and "chlorotic", resulting in disease spots, black spots or injured spots. This will cause the reflectivity of the visible light band to change, resulting in a "green peak red shift"; in the near-infrared band, the spectral reflection size of green plants mainly depends on the cell structure inside the plant leaves. After the disease, the water metabolism of the plant leaf tissue is blocked, and the infestation of pests and diseases continues to aggravate, which will lead to overall damage to the plant, such as cell breakage, death and rot, whole plant wilting, etc., will eventually lead to changes in spectral reflectivity in the near-infrared and short-wave infrared bands, resulting in a "red edge blue shift". The occurrence and development of crop diseases and insect pests are closely related to factors such as the long-term growth and development environment, climatic conditions, soil conditions, and crop types. The pathogens of crop diseases are mainly fungi, bacteria, actinomycetes, and some nematodes. Most pests occur within one year multiple generations of adults overwinter and reproduce in large numbers during the next suitable season, causing crop damage. At different stages after the canopy of fruit trees is damaged by diseases and insect pests, cell tissue will turn yellow, leaf shapes will be incomplete, canopy morphology will be dwarfed, plants will die, and wilting will lead to a decrease in transpiration rate. These symptom processes are all reflected in a certain reflectance spectrum (Figure 1 ).
Figure 1 Reflection spectrum curve of citrus canopy.
As a new type of remote sensing technology that emerged relatively recently, hyperspectral remote sensing has received widespread attention in the monitoring, identification and application research of crop diseases and pests. According to the different data collection methods, it is divided into two types: imaging and non-imaging. The principle of non-imaging hyperspectral is to measure the average light within the head-up field of view of the sensor probe. It is mostly used for spectral change analysis of plant canopy and leaf characteristics. The commonly used one is the ground object spectrometer of ASD Company, while the imaging hyperspectral adopts snapshot type (window scanning type) imaging hyperspectral sensor has the best performance. It can obtain a hyperspectral "cube" in the entire area with one sweep. This "cube" has the form and structure of an "image cube", and the data acquisition is stable and timely. It embodies the advantages of “map-in-one” imaging hyperspectral (Figure 2) and has become an indispensable spectral sensor for crop phenotypic analysis and monitoring and identification of different pests and diseases. Non-imaging hyperspectral sensors on ground platforms and airborne imaging hyperspectral sensors on aerial platforms have been widely used and developed in the monitoring, identification and classification of fruit diseases and insect pests, while spaceborne imaging hyperspectral sensors under the influence of spatial resolution are widely used in fruit and insect pests monitoring are relatively few applications in monitoring. Due to its resolution limitation, it is mainly used in large-scale crop planting area extraction and growth monitoring. With the development of "satellite-air-ground" hyperspectral remote sensing multi-source and multi-platform, multiple combination options are provided for remote sensing monitoring of fruit tree diseases and insect pests and analysis and research in different application directions. Research methods have also evolved from classic statistical analysis to artificial intelligence, pattern recognition, deep learning, big data analysis and other directions. Therefore, it is possible to use hyperspectral remote sensing technology to conduct quantitative analysis and quality detection of early diagnosis, stress classification, monitoring and identification , and damage levels of fruit tree diseases.
Figure 2 Hyperspectral cube.
Basic principles of hyperspectral monitoring of pests and diseases:
The hyperspectral remote sensing technology of the satellite-air-ground platform provides a variety of mode or combination choices for the research and application of fruit diseases and insect pests. At the same time, hyperspectral imaging technology using drones as payloads is increasingly favored by research. Most scholars combine hyperspectral remote sensing, agronomy, pathology, plant protection theory and computer technology, and expand from traditional statistical analysis to machine learning, deep learning, artificial intelligence, image and pattern recognition, and big data analysis. This article first briefly describes the basic principles, data acquisition methods and technical points of hyperspectral remote sensing monitoring, and then starts with the early diagnosis of diseases and insect pests through fruit hyperspectral remote sensing, spectral response of diseases and insect pests, monitoring and identification of different pests and diseases, quantitative analysis of the damage of diseases and insect pests, and non-destructive detection of pests and diseases. The research progress in this field was discussed in depth, and combined with the actual hyperspectral research in recent years, the trends and future prospects of the application of hyperspectral remote sensing in fruit diseases and insect pests were put forward.
Technical ideas and main content
1. Early diagnosis of fruit diseases and insect pests
The prevention and control of pests and diseases adheres to the principle of "prevention first, early detection, early prevention and control". Traditional agricultural production management has problems such as insufficient timely monitoring of information on agricultural conditions of pests and diseases, monitoring results are displayed in a qualitative manner, and the monitoring results cannot be quantified. Hyperspectral technology can determine the occurrence of diseases as early as possible by identifying small physiological changes in crops. The effects of pests and diseases on crops are mainly divided into external morphological and internal physiological changes. Any change will inevitably lead to changes in the spectral characteristics of crops, especially changes in mid- and near-infrared spectral characteristics. Yingshi Zhao and others pointed out that only when the reflectivity of the near-infrared band changes, the reflectivity of the visible light band will change. In terms of observing pests and diseases, the monitoring of spectral characteristics in the infrared band is much faster than with the naked eye, which is of great significance for the early prevention and control of pests and diseases. Delalieux et al. used apples from multiple periods to analyze the spectral change characteristics of scab-stressed leaves and healthy leaves, and found that the initial stage of leaf infection can be quickly identified in the spectral range of 1375~1750, 2200~2500nm, while in the spectral range of 580~660nm, In the range of 685~715nm, diseased leaves can be quickly and accurately identified 3 weeks after infection. Huilan Mei et al. obtained hyperspectral images of five types of citrus leaves in the range of 370 to 1000 nm, including health, different disease levels, and zinc deficiency, and used partial least squares discriminant analysis to construct a hierarchical monitoring model for citrus Huanglongbing. When Oerke et al. used changes in spectral characteristics of grape leaves at different periods to analyze and monitor the degree of downy mildew infection, they found that the longer the days of inoculation, the greater the spectral difference between healthy and diseased leaves, and the greater the number of spectra that can be used for disease monitoring. 400, 1400, and 1900nm can be used for early prediction. Red-edge wavelengths should be used for disease detection on the 8.5th day after vaccination, and detection in the 500~700nm range should be used for disease diagnosis on the 9.5th day after vaccination. Through literature search and analysis, although there are relatively few domestic and foreign research results on the application of hyperspectral technology in the control of fruit diseases and insect pests, the application potential has been fully confirmed, and the hot bands for early diagnosis research are concentrated in the near-infrared and "red edge" positions. For early diagnosis and monitoring of pests and diseases, it is necessary to combine hyperspectral remote sensing information, crop pathogenesis mechanisms and meteorological environmental conditions. The use of long-term remote sensing data to carry out habitat monitoring of pests and diseases is one of the key technologies to achieve early prevention and control of pests and diseases.
2. Spectral response to fruit diseases and insect pests
From the above analysis, it can be seen that the response of crops to the electromagnetic spectrum is mainly determined by the surface characteristics and internal physiological characteristics of the crop. The plant's own pigments, cell structure, and water vapor absorption affect and determine the spectral characteristics of visible light, near-infrared, and short-wave infrared ranges respectively. As can be seen from Figure 3, due to the existence of strong absorption bands of chlorophyll and carotenoids, the reflectivity of green healthy vegetation in the visible light band is low. At the same time, there are two absorption valleys in the blue and red spectrum bands, and there is a strong reflection peak in the green light band; however, in the 700-770nm band between the visible red light band and the near-infrared band, the vegetation spectral reflectance curve rises sharply and is almost a vertical straight line. The slope of this band range is closely related to the chlorophyll content per unit area of the vegetation. It is called the "red edge position" in the academic circles; thereafter there are two absorption valleys near 1400~1900nm in the short-wave infrared, mainly caused by the strong absorption of water vapor. After being infected by pathogens, chlorophyll is destroyed, the spectral reflectivity in the visible range is enhanced, and the red edge position moves toward the shortwave direction. At the same time, when infected plants are severely stressed, they will experience changes in leaf inclination and even canopy morphology changes such as plant lodging. When the stress reaches a certain critical threshold, the water metabolism inside the crop plant will be destroyed, resulting in serious water shortage of plants and leaves, which will cause changes in reflectivity in the near-infrared band. The reflectivity in the infrared band increases and decreases, and the spectral responses corresponding to different pests and diseases are not consistent, but the absorption valley reflectivity increases near 1400 and 1900 nm.
Figure 3 Changes in spectral curves caused by different pests and diseases.
Garcia-Ruiz et al. used two different imaging systems to identify citrus Huanglongbing. The results showed that there were significant differences in the reflectance spectra of healthy and infected fruit trees at the wavelength of 710nm and the red edge wavelength. The classification accuracy of the model was between 68% and 75%. A Tianyuan six-rotor drone equipped with an ATH9010 imaging spectrometer was used to classify and identify citrus plants suffering from Huanglongbing disease using a continuous projection algorithm. The classification accuracy exceeded 95%, and the best identification characteristic bands (698, 762nm) were extracted. Based on the hyperspectral spectrum of citrus leaves, Dongmei Guo used stepwise discriminant analysis to screen out 9 characteristic wavelengths of citrus Huanglongbing (400.19, 403.17, 406.15, 407.64, 412.12, 721.14, 730.74, 740.34, 823.98nm). Ming Tan et al. used hyperspectral image recognition technology to conduct research on the identification of citrus canker diseases. They believed that normal citrus fruit tree leaves and canker diseased leaves have good spectral responses at 510.9, 575.4, 600.88nm in the visible light band and 998.97nm in the near-infrared band. Jiangbo Li et al. used navel oranges as the research object, based on hyperspectral imaging and used characteristic band principal component analysis and band ratio algorithms to classify and identify canker fruits, and extracted 5 canker characteristic bands (630, 685, 720, 810, 875nm), the correct recognition rate reaches 95.4%. Knauer et al. used non-imaging hyperspectral (400~2500nm) and imaging spectrometers HySpex VNIR1600 and HySpexSWIR-320m-e to conduct research on the identification of grape powdery mildew. They extracted characteristic spectral bands ( 440, 498, 549, 640, 651, 811, 1081, 1652, 2253nm) and texture features were extracted based on the integral image, and the recognition and classification accuracy reached 99.8%. Shuxian Wen and others used hyperspectral imaging technology to identify Dangshan Suli with anthracnose, and also extracted the characteristic wavelengths for identifying Suli anthracnose, which are 572.0, 613.2, 652.6, 749.2, 806.5, and 874.6nm respectively. It can be seen that the spectral response to specific fruits and their pests and diseases in the visible-short wave infrared band range is very obvious. Research on citrus diseases and pests is relatively common, and it is also a general trend to gradually expand the research and application to other fruits and fruit tree diseases and pests. These sensitive bands or specific wavelengths can provide a basis for the subsequent development of low-cost monitoring instruments for specific varieties.
3. Identification of different fruit diseases and insect pests
Hyperspectral technology can not only classify and extract plants stressed by the same disease and pest on a single fruit tree, but can also identify different diseases and pests on fruit trees and the same disease and pest on different fruit trees. This is also the focus of hyperspectral technology being used in the monitoring, identification and prevention of crop diseases and pests. Qin et al. used the spectral information divergence method (SID) to identify diseased grapefruits, with an accuracy of 96.2%. Dongmei Guo collected hyperspectral images of citrus leaves infected with brown spot, scab and canker, analyzed and compared the spectral reflectance characteristics of the disease spots and different nearby tissues, and extracted the spectral characteristic bands (404.66, 421.10, 428.60, 434.62, 436.12, 446.68, 618.04, 700.40, 719.55, 727.54, 864.38, 938.93, 998.96nm) that distinguish the three diseases, and used characteristic bands combined with multi-directional Fisher linear discriminant analysis method, the identification rate of brown spot, scab and canker is 100%. Jiantao Wang et al. used a hyperspectral imaging system to extract 81 bands between 450 and 900 nm as model input data, and constructed a convolutional neural network-based classification model for citrus canker, red spider mites and other stress disease leaves. When the number of iterations is 1000 and the learning rate is 0.001, the accuracy of model recognition reaches 98.75%. Abdulriaha et al. used a hyperspectral imaging system to collect hyperspectral images of diseased avocado leaves, and used two classification algorithms, including multi-layer perceptron (MLP) and decision tree (DT). The highest accuracy can reach 100% in identifying avocado fusarium wilt and nitrogen deficiency. Jianhua Zhang et al. started with local image information of pomelo and grape diseased leaves, and used the optimal binary tree support vector machine and convolutional neural network area suggestion algorithm to identify and detect 4 kinds of pomelo leaf diseases and 6 kinds of grape diseased leaves. Research shows that it is possible to use different classification algorithms to identify different pests and diseases based on hyperspectral images, and the accuracy is high. Table 1 shows the hyperspectral classification algorithms used in some research on fruit pest and disease identification.
Table 1 Some hyperspectral classification algorithms
|
Fruit name |
Pest and disease |
Research scale |
Algorithm |
Recognition accuracy |
|
Grapefruit |
Cankers, oily spots, insect infestations, melanogaster, scabs, wind marks |
fruit |
Spectral Information Divergence Method |
96.20 |
|
Tangerine |
Brown spot, scab, cankers |
leaves |
Multi-directional Fisher linear discriminant analysis method |
100.00 |
|
Tangerine |
Cankers, spider mite, sooty disease, herbicide stress |
leaves |
Convolutional neural network |
98.75 |
|
Avocado |
Blight, hypoxia |
leaves |
Multi-layer perceptron, decision tree |
100.00 |
|
Pomelo |
Yellow spot, anthrax, scab, sooty disease |
leaves |
Optimal binary tree support vector machine |
94.16 |
|
Grape |
Brown spot, powdery mildew, gray mold, downy mildew, black pox, scab |
leaves |
Convolutional neural network area suggestion algorithm |
75.52 |
Due to the huge spectral characteristics and image characteristics of hyperspectral, the large amount of data, the redundancy of high-dimensional information leads to long processing time, and the difficulty of data dimensionality reduction, feature extraction and selection methods, data dimensionality reduction methods and pre-processing methods of data etc. will affect the discrimination accuracy. At the same time, the selection of algorithms and the combination of different algorithms will greatly improve the accuracy of model identification. Research shows that incorporating deep learning is an effective method for identifying crop diseases and insect pests and improving accuracy.
4. Quantitative analysis of damage caused by fruit diseases and insect pests
On the basis of classification and identification of fruit diseases and insect pests, quantitative evaluation and analysis of the degree of damage of diseases and insect pests is of great significance for guiding the precise application of pesticides in orchards and other operations management. Quantitative analysis of hyperspectral and its imaging technology provides the possibility for this. Dongxing Xing et al. analyzed the reflectance spectral characteristics of Red Fuji apple trees under various levels of red spider mite pest and yellow leaf disease stress, constructed 6 spectral indices and established red mite pest and yellow leaf disease levels (normal, mild, moderate and severe) assessment mathematical models, the assessment accuracy rates are 96% and 98% respectively. Similarly, Shuxian Wen et al. collected hyperspectral images of the entire process from the initial stage of anthracnose inoculation to the onset and decay of crispy pear samples and 210 samples as research objects, using methods such as threshold segmentation method, weight coefficient method, principal component analysis, and cluster analysis. The correct identification rate of samples was 98.41%. According to the K-Means classification of time-series hyperspectral images, it was found that the symptoms of crispy pear were obvious on the 2nd and 3rd days. It was inferred that this period is the most beneficial to apply diagnosis and treatment methods to the disease. As the disease degree further deepens, the moisture content of the diseased area increases and the spectral reflectance decreases. Huilan Mei et al. collected hyperspectral images of healthy, diseased, and zinc-deficient citrus leaves in the wavelength range of 370 to 1000 nm, and established a partial least squares discrimination model, with a model discrimination accuracy of 96.4%. Similarly, Yande Liu et al. also collected hyperspectral images of five categories of citrus leaves that were identified as mild, moderate, severe, zinc deficient and normal, and used the least squares support vector machine method to build the best citrus Huanglongbing discrimination model, and misjudged rate is 0. Ye Sun used image segmentation algorithms and statistical methods to select three effective single-band images of 709, 807, and 874nm from the hyperspectral image of the peach whole fruit. By setting thresholds, he positioned the rotten and healthy areas of the peach, and identified severely rotten, normal, and rotten areas. The detection accuracy of rotten, lightly rotten and healthy peaches reached 100%, 100%, 66% and 99% respectively. This study shows that the detection and identification of healthy fruits and rotten fruits are good, while the ROI pixels on the surface of mildly rotten fruits are smaller and inappropriate than hyperspectral imaging, resulting in low detection accuracy. It was found in the literature analysis that in the quantitative analysis of the damage degree of fruit diseases and insect pests, most scholars use the damage level of fruit diseases and insect pests as the dependent variable. The independent variable can be the full band, characteristic wavelength or specific interval spectrum, based on statistical regression analysis methods (PLSR, FLDA, SVM, Logistic regression, multi-linear regression, Dirichlet aggregation regression or classification algorithms (SAM, DT, ANN)) are used to conduct research based on specific disease and pest characteristic maps or characteristic bands. The Spectral Vegetation Index (SVI) is a geometric collection of linear and nonlinear features between different spectral bands of remote sensing sensors. It reflects the growth status of crops during the growth period from different angles and has received widespread attention. It is used to carry out crop disease specific data analysis, using different wavelength data to construct a specific pest identification index (SDI). Compared with simple SDI, specific SDI can realize quantitative inversion analysis of specific pests and diseases more quickly and easily. Like SVI, the construction of specific fruit SDI will also become a research direction for quantitative analysis of fruit pest and disease damage levels.
5. Non-destructive testing of fruit diseases and insect pests
During the production, storage, transportation and marketing process, fruits are susceptible to infection by pathogens and pests, which will have a certain impact on their physiological functions and tissue structure. Abnormal symptoms such as spots, rot, mildew and insect infestation will appear, thus causing losses to the fruit industry and affecting food safety. Non-destructive testing of fruit quality has always been a research hotspot and important topic in the field of agricultural engineering. Non-destructive testing and accurate evaluation of fruit diseases and insect pests have become an important measure to improve fruit quality and ensure food safety. Non-destructive detection of fruit diseases and insect pests is mainly based on near-infrared transmission spectroscopy technology and hyperspectral imaging technology. Donghai Han et al. developed an apple water core disease detector based on short wave near-infrared transmission spectroscopy. The test results found that the transmission spectrum intensities of different levels of apple water core disease are different, thus achieving the identification of apple water core disease, compared with similar detection methods around the world, this method has a high detection accuracy and the equipment is simple and easy to operate. In addition, Donghai Han and others also used transmission spectroscopy technology to conduct non-destructive testing of internal browning of apples, with an accuracy of 95.65%. Based on near-infrared transmission spectroscopy, Teerachaichayut et al. used wavelengths of 660 to 960 nm to detect the hard peel disease of mangosteen fruit, and distinguished the spectral characteristics of healthy and diseased mangosteen peels, which can accurately detect the hard peel disease of mangosteen fruit. Sijia Liu et al. used hyperspectral imaging technology to detect Hanfu apples infected with four diseases: anthracnose, bitter pox, black rot and brown spot. They selected 3 characteristic wavelengths, 10 characteristic wavelengths and full-wavelength spectral information. Linear discriminant analysis, support vector machine and BP artificial neural network models were used to identify diseases using different spectral information, and the detection rate of diseased fruits reached 96.25%. Siedliska et al. used hyperspectral imaging technology to detect strawberry infection by spoilage fungi, selected 19 wavelengths as the most suitable wavelengths for strawberry infection identification, and established a supervised classification model. Linzhong Zhang and others conducted research on grape diseases based on near-infrared spectroscopy, and found that the best preprocessing method was multivariate scattering correction, first-order derivative combined with Norris smoothing, and analyzed using a discriminant analysis model, with an accuracy rate of 96.15%. Traditional detection of fruit diseases and insect pests is mostly manual diagnosis, which is inefficient, time-consuming, highly subjective, and internal pests and diseases cannot be identified with the naked eye. Physical and chemical index detection also has problems such as strong destructiveness, cumbersome sample processing, and long detection cycles. Although some of the research results are in the experimental or laboratory research stage, and the sample size is not large, but they are enough to prove that it is feasible to use hyperspectral technology to carry out non-destructive detection of fruit diseases and insect pests, which is of great significance to ensuring the healthy development of the fruit industry and reducing economic losses.
Design
1. Processing of measured data from UAV hyperspectral imager
During the field measurement, the weather was cloudy and the wind speed was low. The sampling time was controlled between 10:00 and 17:00 Beijing time. The UAV-borne hyperspectral imager ATH9010 was used to collect the spectra of citrus Hanglongbing disasterd plants.
2. Application examples
Optosky uses the nationally produced hyperspectral imager ATH9010 to identify citrus Huanglongbing plants. It is less affected by the weather, is close to the ground and acquires high spatial resolution, and the spectral information is more complete. It can identify citrus Huanglongbing plants. The specific process is as follows.
3. Specific implementation process of flight services
3.1. Early preparation stage
(1) First configure drones and other equipment that meet project needs according to project requirements, and prepare a take-out configuration list
Table 2 UAV hyperspectral configuration list
|
Serial number |
Name |
Model |
Quantity |
|
1 |
Hexacopter UAV |
ATP606 hexacopter UAV |
1 |
|
2 |
Hyperspectral imager |
ATH1010 hyperspectral imager |
1 |
|
3 |
Standard reflective whiteboard |
50cm×50cm |
4 |
|
4 |
Drone power battery |
32000mAh high voltage version lithium battery |
3 |
|
5 |
Equipment power supply battery |
Get power from drone |
|
|
6 |
Data acquisition host |
Use onboard computer |
|
|
7 |
Data processing workstation |
12th generation i7/48G/1T or above SSD |
1 |
|
8 |
Data storage and processing disk |
Several blocks above 1T |
1 |
|
9 |
Tool set |
Hexagon socket screw set |
1 |
|
10 |
Airborne computer |
ASUS PN63 Desktop NUC Mini PC |
2 |
|
11 |
Airborne computer screen |
13.3 inches, 2k sharp original IPS screen, full touch screen |
1 |
(2) After the drone is debugged in the company, the external equipment should be packed according to the configuration list and confirmed that nothing is missing;
(3) Conduct preliminary survey and planning of the operation area based on satellite maps, and initially plan 10 take-off and landing points. The estimated field operation time is 1.5 to 2 days (excluding 1 day of survey).
(4) Determine the flight service date based on project requirements and weather conditions.
3.2. Implementation of the flight phase
(1) On-site survey to determine the final flight route. The estimated time is 1 working day;
(2) UAV assembly and debugging;
(3) Implement on-site flight services. The estimated time is 1 working day.
(4) Original data acquisition and summary.
Table 3 Summary of original data acquisition
|
Serial number |
File type |
File name |
The amount of data |
|
1 |
Raw hyperspectral data |
Paragraph 0: 20221021115406.os 20221021115406.hdr Paragraph 1: 20221023093758.os 20221023093758.hdr Paragraph 2: 20221023102439.os 20221023102439.hdr Paragraph 3: 20221023113519.os 20221023113519.hdr Paragraph 4: 202210231135420.os 202210231135420.hdr Paragraph 5: 20221023144621.os 20221023144621.hdr |
180G |
|
2 |
GPS data |
GPS.txt |
600KB |
|
3 |
Other |
Reflectance data |
500GB |
Data processing and project results delivery
1. Data processing process
Original data → data splicing → parameter inversion → production of thematic map of inversion results (showing the distribution of citrus Huanglongbing).
2. UAV flight trajectory in citrus area
According to customer needs, drones are used to draw routes and fly in designated citrus forest areas.
Figure 4 UAV flight trajectory.
3. Invert classification results
In summary, the inversion results show that the current classification results of HLB-infected plants are ideal, with fewer misclassification points. The inversion results well present the spatial distribution of Huanglongbing-infected plants, providing an intuitive data analysis basis for the prevention and control of Huanglongbing disasters.
Figure 5 HLB classification results.
Solution recommendation | Retrieval of vegetation nitrogen and water content based on UAV hyperspectral
Application Case | Application Of ATH3500 Hyperspectral Imager In Rapid Wheat Year Identification
Related Article
