
Example of HSI Applications and Optosky Solutions
author: Peggy
2026-09-16
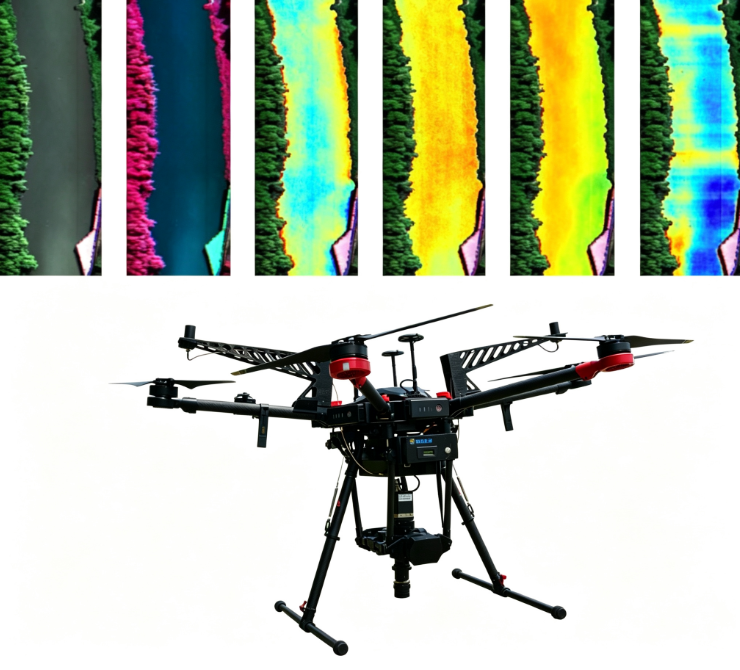
What Does Hyperspectral Imagery Actually Look Like in Practice?
When people ask “Can you give me an example of hyperspectral imagery?”, they are often looking for more than a technical description. They want to see how the technology translates into real decisions—detecting a crop disease before it is visible to the eye, identifying contaminants in food, or mapping mineral deposits across a landscape.
Hyperspectral imaging works by capturing hundreds of narrow spectral bands for every pixel in an image, creating a three-dimensional data cube that contains both spatial and spectral information. This means each pixel has an associated spectral curve—a kind of “fingerprint” that reveals what the material is and how it is changing.
Example 1: Agricultural Monitoring—Seeing Crop Stress Before It Shows
In agriculture, hyperspectral imagery has been used to monitor crop health, detect nutrient deficiencies, and identify pest infestations at early stages. The technology has been applied to wheat breeding research, where full-spectrum VNIR-SWIR imagery helped distinguish differences in wheat spike development and generate data for estimating grain filling rates.
Optosky’s ATH9030 UAV hyperspectral imaging system is designed for exactly this kind of work. It supports real-time spectral image viewing during flight, allowing operators to validate data on-site and re-fly if needed. The built-in downwelling light sensor corrects for illumination changes, improving data consistency across different times and weather conditions. For agricultural monitoring, this means more reliable crop growth assessment and pest detection.
Example 2: Food Safety—Detecting Contaminants Without Damage
Hyperspectral imaging has proven valuable in food quality and safety inspection. In one application, Optosky’s hyperspectral imaging technology was used to identify components of frozen meals, detecting additives, preservatives, and seasonings by analyzing spectral signatures across visible and near-infrared bands.
The advantage here is non-destructive detection: the sample remains intact while its internal chemical composition and spatial distribution are analyzed. This is particularly important for food products where contamination or mislabeling can have serious consequences. Optosky’s ATH3500 hyperspectral imager supports this type of analysis across a wide spectral range, enabling detection of subtle compositional differences.
Example 3: Environmental Monitoring—Mapping Water Quality and Vegetation
Environmental applications of hyperspectral imagery are extensive, including water quality monitoring, vegetation health assessment, and pollution detection. Optosky’s ATW2320 underwater hyperspectral radiometer is specifically designed for water color monitoring in oceans, lakes, and rivers. It covers a spectral range of 180–1100 nm with high sensitivity and can operate at depths up to 100 meters.
This type of instrument provides the spectral data needed for satellite validation, photosynthesis studies, and marine biology research. For environmental agencies and research institutions, hyperspectral imagery offers a way to monitor large areas with detail that conventional imaging cannot match.
Example 4: Industrial and Material Analysis—Mineral Mapping and Sorting
In geology and mining, hyperspectral imagery is used for mineral mapping and composition detection. Optosky’s ATH3100 rotating scanning hyperspectral imager is suitable for geological applications including mineral mapping, mineral composition detection, and ore-forming prediction. The system’s wide spectral coverage—with options for 370–1000 nm, 900–1700 nm, and 1200–2500 nm—allows identification of different mineral types based on their unique spectral signatures.
For industrial sorting, hyperspectral imaging can distinguish materials that appear identical to the human eye. This capability is increasingly used in recycling, where different plastic types need to be separated, and in quality control, where foreign objects must be detected on production lines.
Choosing the Right Hyperspectral Tool for Your Application
The diversity of these examples highlights an important point: hyperspectral imaging is not a single solution but a platform technology that can be adapted to many problems. The key is matching the spectral range, resolution, and form factor to the specific application.
Optosky’s product portfolio spans handheld, benchtop, drone-mounted, and underwater systems, covering wavelengths from ultraviolet through shortwave infrared. For a researcher looking to explore hyperspectral imaging for the first time, the ability to start with a focused application and expand from there is a significant advantage.
Whether the goal is monitoring crop health, ensuring food safety, or mapping mineral resources, hyperspectral imagery provides information that goes far beyond what conventional imaging can deliver. The examples above are not theoretical—they represent active work being done today with tools that are increasingly accessible and adaptable.
Precision fertilization by UAV for rice at tillering stage in cold region based on hyperspectral remote sensing prescription map
How Much Does a Hyperspectral Imaging System Cost? A Practical Guide
Related Article

Understand what drives hyperspectral imaging system cost, from sensor type and spectral range to software and integration. Compare market price ranges and find the right fit with Optosky.
How Much Does a Hyperspectral Imaging System Cost? A Practical Guide

Explore how hyperspectral imaging with Optosky’s ATH1010/ATH8100 series enables rapid, non‑destructive ore identification, grade classification, and impurity removal. Using continuous spectral data and machine learning, the system distinguishes minerals even with similar colours – driving intelligent, automated sorting for iron, copper, lithium, and other mineral resources.
Test Case | Hyperspectral ATH1010/ATH8100 Series Ore Testing
Discover how UAV‑based hyperspectral imaging and deep learning can monitor SDI, TOC, and TEP – key membrane fouling indicators for seawater desalination during harmful algal blooms. Based on a recent Water Research study, this article explores how Optosky's ATH9010 enables spatial risk mapping and proactive intake management.
Applications | ATH9010 Enables Water Quality and Membrane Fouling Monitoring for Desalination During Algal Blooms
Choosing between 785 nm and 1064 nm for Raman? This guide explains the physics of fluorescence, compares signal strength and fluorescence suppression, and provides a step‑by‑step decision tree. Real‑world drug detection and pesticide examples show why wavelength matters – and how dual‑wavelength coverage offers the ultimate solution.
785 nm or 1064 nm? Fluorescence Is the Dividing Line