Example of TOC testing of pharmaceutical equipment cleaning validation
Example of TOC testing of pharmaceutical equipment cleaning validation
In the pharmaceutical industry, contamination by product residues and detergents can be prevented by cleaning equipment. However, until now, it has been difficult to find a cleaning procedure or material that can completely clean the equipment. After cleaning, there will always be a certain amount of residue left on the surface of the equipment. To verify the effectiveness of this cleaning procedure, the verification methods are different for different residues. Total organic carbon (TOC) testing is an important quality control measure to ensure water purity and equipment cleanliness. It can be implemented to meet various sampling occasions and efficiency requirements. Today, a user of a pharmaceutical company in Shanghai formulated a cleaning method based on product properties, production processes and other factors, and implemented equipment cleaning in accordance with the established cleaning procedures. It also used a TOC 3000 total organic carbon analyzer to analyze the TOC content in the clean water of its pharmaceutical equipment. Verify the cleaning effectiveness of pharmaceutical equipment.
Experimental part
1. Instruments and reagents
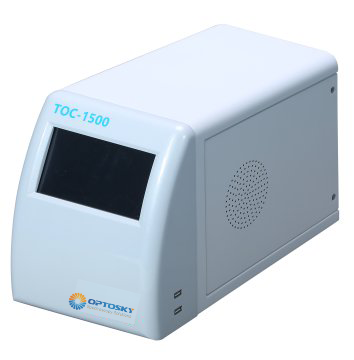
1.1 Instrument: TOC-3000 total organic carbon analyzer
1.2 Reagents:
Potassium hydrogen phthalate (baseline reagent)
Sodium persulfate (excellent grade pure)
Phosphoric acid (excellent grade pure)
Distilled water without carbon dioxide (blank sample)
2. Experimental methods
2.1 Preparation of standard solution
2.1.1 Organic carbon standard solution configuration
2.1.1.1 Organic carbon (TOC) standard stock solution: (ρTOC= 1000 mg/L) Accurately weigh 2.1253 g of potassium hydrogen phthalate (dried to constant weight at 110 ℃ ~ 120 ℃ in advance), and place it in a beaker, add pure water to dissolve, transfer this solution to a 1000 mL volumetric flask, dilute to the mark with pure water, and mix well.
2.1.1.2 Inorganic carbon (TIC) standard stock solution: (ρTIC=1000 mg/L) Accurately weigh 4.4085 g of anhydrous sodium carbonate (preliminarily dried at 105°C to constant weight) and sodium bicarbonate (preliminarily dried in a desiccator) 3.5000 g, place it in a beaker, add pure water to dissolve, transfer this solution to a 1000 mL volumetric flask, dilute it with pure water to the mark, and mix well.
2.1.1.3 Total carbon standard solution: (ρTC= 200 mg/L, ρTIC= 100 mg/L) Use a single-marked pipette to add 40.00 mL of inorganic carbon standard stock solution and organic carbon standard stock solution to a 200 mL volumetric flask respectively. Dilute to the mark with pure water and mix well.
2.1.1.4 Inorganic carbon standard solution: (ρTIC= 100 mg/L) Use a single-marked pipette to suck 20.00 mL of the inorganic carbon standard stock solution into a 200 mL volumetric flask, dilute to the mark with pure water, and mix.
2.2 Drawing of standard curve
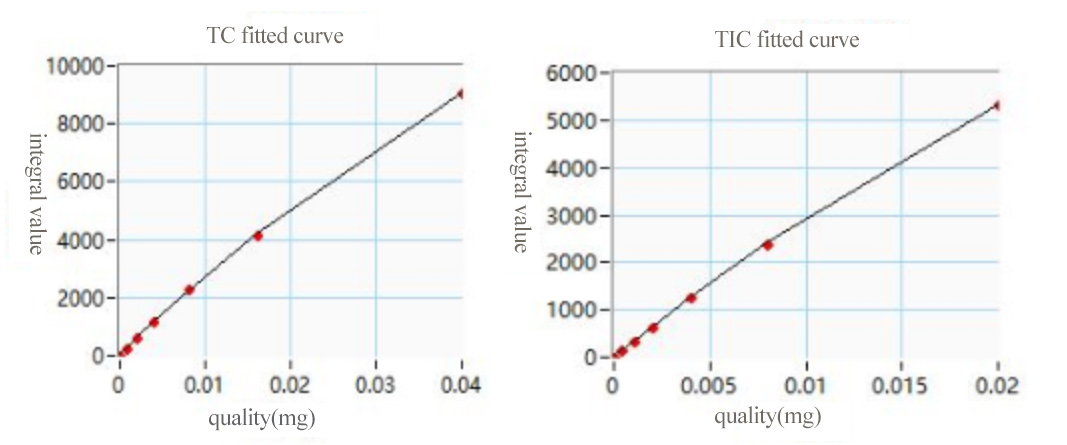
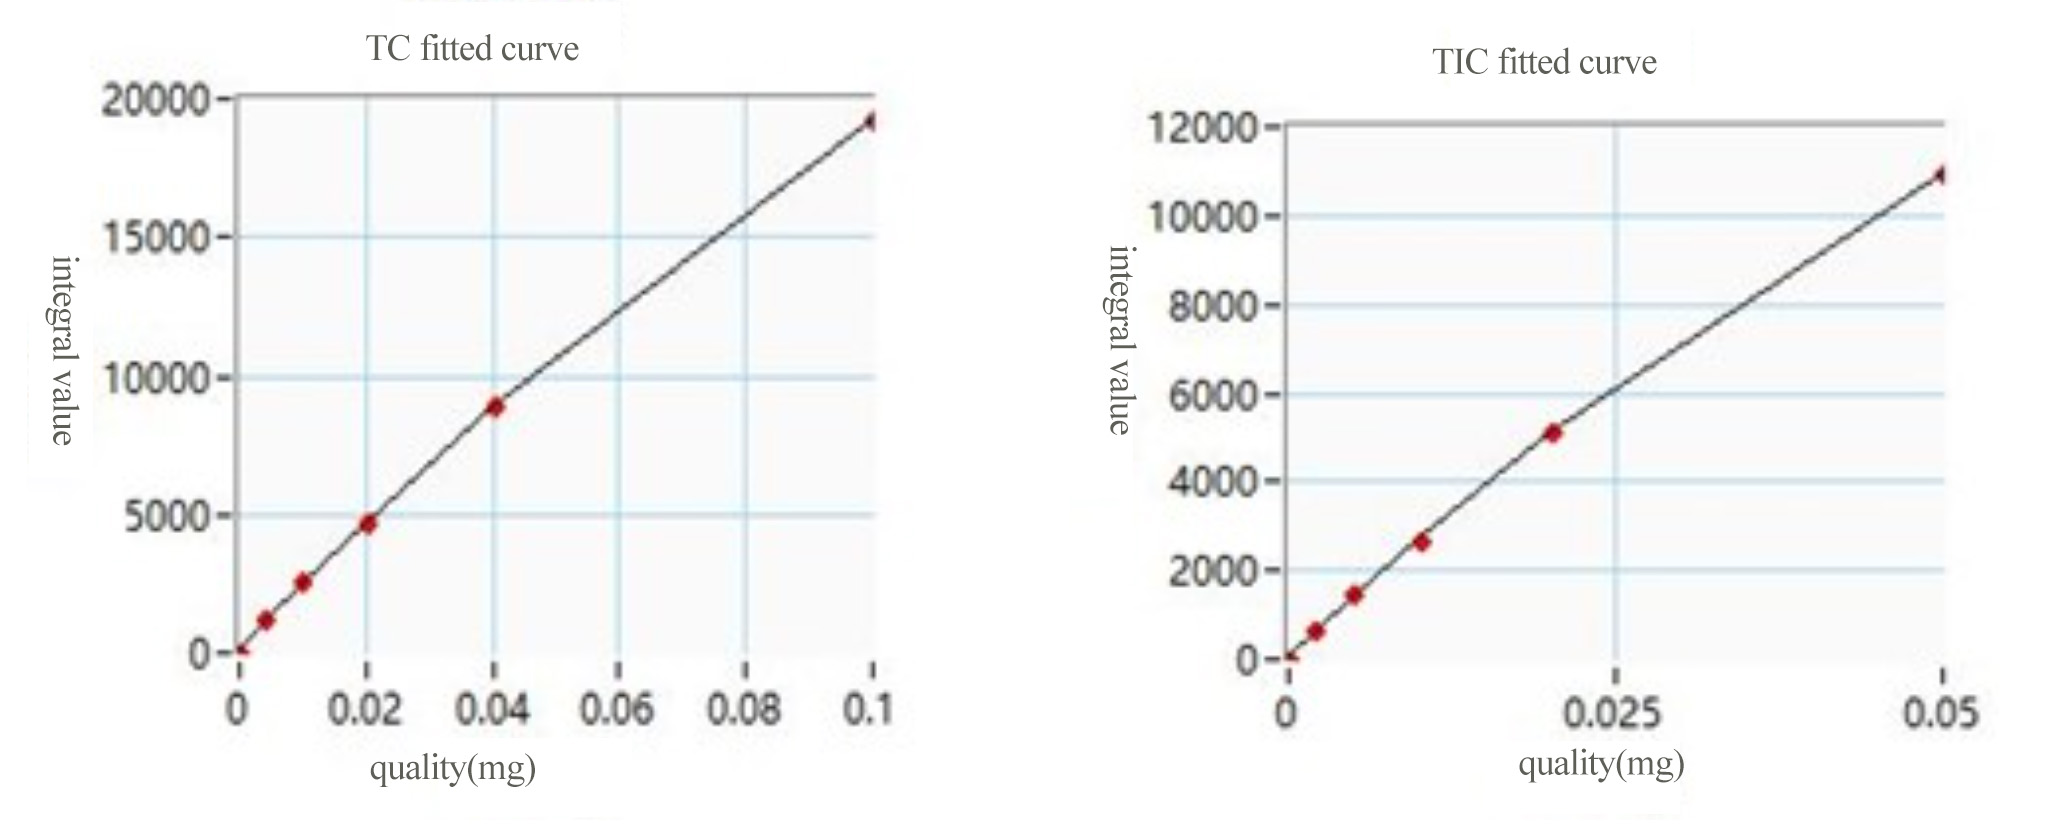
2.2.1 Prepare a series of standard solutions with total carbon concentrations of 0.0, 20.0, 40.0, 60.0, 80.0, and 100.0 mg/L, and use the same volume to inject samples with different concentrations. Take the mass of carbon as the abscissa and the integrated area signal as the ordinate is used to draw the calibration curve.
2.2.2 Prepare a series of standard solutions with inorganic carbon concentrations of 0.0, 10.0, 20.0, 30.0, 40.0, and 50.0 mg/L, and use the same volume to inject samples with different concentrations. Take the mass of carbon as the abscissa and the integrated area signal as the ordinate is used to draw the calibration curve.
3. Sample testing
Select the difference subtraction test mode to test the blank page, standard point and sample in sequence.
4. Results and discussion
TC curve equation: Y=-468666.6X2+238166.9X+157.7 R2=0.9998
TIC curve equation: Y=-1157617.9X2+275288.8X+84.1 R2=0.9998
|
Sample name |
Serial number |
TC (mg/L) |
RSD (%) |
Average value(mg/L) |
TIC (mg/L) |
RSD (%) |
Average value(mg/L) |
TOC (mg/L) |
|
Clean water |
1 |
0.7753 |
1.9% |
0.7707 |
0.2053 |
1.0% |
0.1994 |
0.5713 |
|
2 |
0.7710 |
0.1889 |
||||||
|
3 |
0.7719 |
0.1942 |
||||||
|
4 |
0.7358 |
0.1893 |
||||||
|
5 |
0.7722 |
0.2143 |
||||||
|
6 |
0.7979 |
0.2046 |
It can be seen from Figure 1, Figure 2 and the final fitting results that after quadratic curve fitting, the correlation coefficient R2 of TC and TIC is both 0.9998, indicating that the linear relationship between the two is good; the sample was tested in parallel six times using the difference subtraction method. After deducting the blank, the relative standard deviations of TC and TIC are less than 2%, and the data has good repeatability. After final processing, it can be concluded that the TOC content of the clean water of the pharmaceutical equipment is 0.5713 mg/L. This result shows that this time There is still a small amount of residue left on pharmaceutical equipment after cleaning. This data can provide reference for the next stage of production or further in-depth cleaning processes.
Water quality standards related to TOC analysis
Total organic carbon analyzer unique dehydration technology dehydration efficiency
Related Article