
Study on the degree of damage to the Asian carlocust with hyperspectral remote sensing model
author: cily
2023-01-03
Asiatic locust (Oedale usasiaticus B. Bienko) is a grasshopper in northern my country.The original dominant species of locust, which feeds on grasses, is a serious hazard in northern my country.one of the grasshoppers of the steppe.
Spectral information extracted from hyperspectral data can estimate crop biological parameters, plants will cause changes in the reflectance spectrum curve under the interference of external conditions change.
Use field spectrometers to measure their partial reflection spectra of various bands under certain conditions to study plant diseases and insect pests Post-growth status.
In this study, hyperspectral remote sensing technology was used to measure vegetation canopy by spectrometer
Spectrum, then measure the leaf area index (LAI) of the plant, and screen through the regression model
Hyperspectral characteristic parameters, and finally establish a pest spectral index model,The occurrence and damage of grasshopper locusts can be reliably and accurately predicted.
The measured spectral range is 350 2 500 nm, and the wavelength accuracy is ±1 nm.
The sampling interval from 350 nm to 1 000 nm is 1.4 nm, and the spectral resolution is 3 m;
The sampling interval from 1 000 nm to 2 500 nm is 2 nm, and the spectral resolution is 10 nm.
The weather is fine, the visibility is good, and the spectrum of the grassland canopy is measured when there is no wind or cloud, and the spectral reflectance of the canopy is measured from 10:00 to 14:00. When observing, the field of view.Angle is 25. , the probe of the sensor is vertically downward, and the vertical height from the top of the canopy is about 1.3m, forming an observation range with a diameter of 0.5 m. To avoid random noise interference,Each sample was measured 10 times, and the average value was taken as the final spectrum.
Results and Analysis
The canopy light spectra of normal growing sheepgrass and sheepgrass affected by Asian locust were measured.
Seven parameters with high variability were selected from the 25 hyperspectral parameters (Table 1).The results showed that the red edge moved 44 nm to the short-wave direction after being harmed by locusts,The blue edge shifts 18 nm to the long-wave direction, and the near-infrared shifts 23 nm to the short-wave direction,The near-infrared first-order differential spectrum change rate is as high as 52.9%; the red edge and near-infrared first-order.The area enclosed by the derivative spectrum decreases.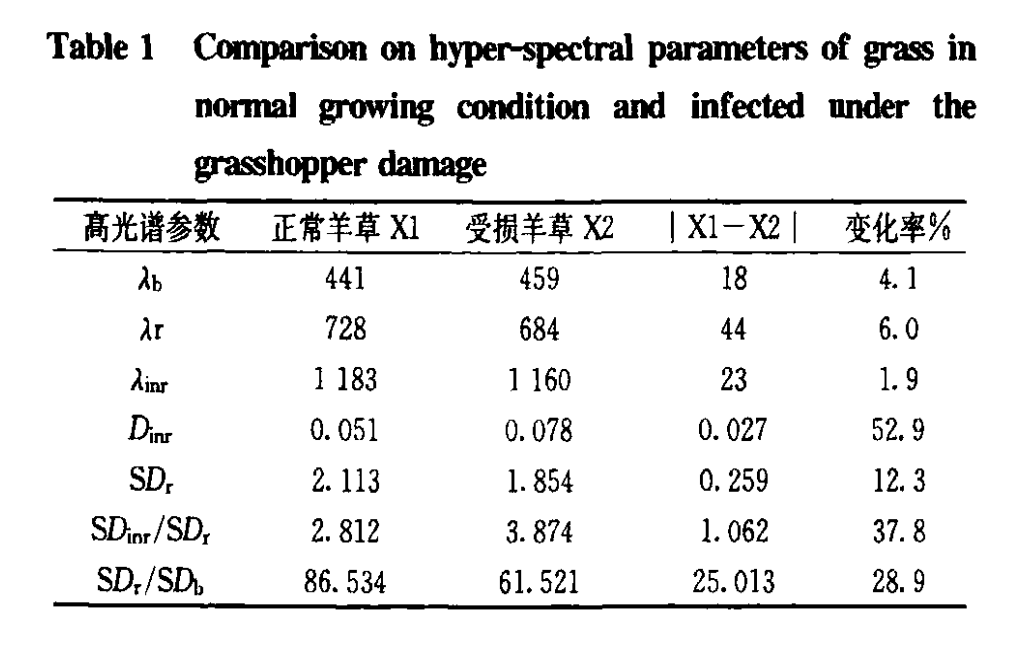 The results of this study are based on a region, a result of locust damage.
However, further verification is needed for other species of locusts in other regions. There is still
Some studies use multidimensional partial least squares (NPLS) algorithm to establish 3D hyperspectral prediction Mathematical Model for Measuring Yield,compare the advantages and disadvantages in the regression effect, choose A hyperspectral model optimized for locust monitoring.
Spectral information extracted from hyperspectral data can estimate crop biological parameters, plants will cause changes in the reflectance spectrum curve under the interference of external conditions change.
Use field spectrometers to measure their partial reflection spectra of various bands under certain conditions to study plant diseases and insect pests Post-growth status.
In this study, hyperspectral remote sensing technology was used to measure vegetation canopy by spectrometer
Spectrum, then measure the leaf area index (LAI) of the plant, and screen through the regression model
Hyperspectral characteristic parameters, and finally establish a pest spectral index model,The occurrence and damage of grasshopper locusts can be reliably and accurately predicted.
The measured spectral range is 350 2 500 nm, and the wavelength accuracy is ±1 nm.
The sampling interval from 350 nm to 1 000 nm is 1.4 nm, and the spectral resolution is 3 m;
The sampling interval from 1 000 nm to 2 500 nm is 2 nm, and the spectral resolution is 10 nm.
The weather is fine, the visibility is good, and the spectrum of the grassland canopy is measured when there is no wind or cloud, and the spectral reflectance of the canopy is measured from 10:00 to 14:00. When observing, the field of view.Angle is 25. , the probe of the sensor is vertically downward, and the vertical height from the top of the canopy is about 1.3m, forming an observation range with a diameter of 0.5 m. To avoid random noise interference,Each sample was measured 10 times, and the average value was taken as the final spectrum.
Results and Analysis
The canopy light spectra of normal growing sheepgrass and sheepgrass affected by Asian locust were measured.
Seven parameters with high variability were selected from the 25 hyperspectral parameters (Table 1).The results showed that the red edge moved 44 nm to the short-wave direction after being harmed by locusts,The blue edge shifts 18 nm to the long-wave direction, and the near-infrared shifts 23 nm to the short-wave direction,The near-infrared first-order differential spectrum change rate is as high as 52.9%; the red edge and near-infrared first-order.The area enclosed by the derivative spectrum decreases.
However, further verification is needed for other species of locusts in other regions. There is still
Some studies use multidimensional partial least squares (NPLS) algorithm to establish 3D hyperspectral prediction Mathematical Model for Measuring Yield,compare the advantages and disadvantages in the regression effect, choose A hyperspectral model optimized for locust monitoring.
What is the hyperspectral imaging?
Nitrogen detection in cotton leaves based on hyperspectral
Related Article

Discover Optosky’s air–ground collaborative hyperspectral solution for mine ecological restoration monitoring. Combining UAV hyperspectral imaging, fixed-point rotating-scan systems, and field spectroradiometers, it supports vegetation, soil, mineral alteration, and water environment monitoring for green mine evaluation and restoration acceptance.
Applications | Hyperspectral Mine Restoration Monitoring
Compare single InGaAs and CMOS+InGaAs detector architectures in hyperspectral imaging. Learn why both can cover 400–1700 nm, how visible-light-extended InGaAs works, and the trade-offs in calibration, spectral registration, and system integration for applications in agriculture, food safety, and industrial inspection.
Technology | Single InGaAs vs. CMOS+InGaAs in Hyperspectral Imaging
Discover how hyperspectral imaging combined with multi-feature fusion (PCA + 2DCOS + CARS) enables non-destructive three-level grading of chili pepper sunburn with 97.2% accuracy. Learn about the ATH3000 system and Optosky's customized solutions for horticultural crop quality inspection and damage classification.
Can Sunburned Chili Peppers Be Non-Destructively Graded? Hyperspectral Imaging ATH3000 Offers a New Answer
Discover the Optosky ATH9600 multi-lens UAV-borne multispectral imaging system—featuring 67° ultra-wide FOV, synchronous snapshot, 3.75 μm large pixel, and native DJI X-Port integration. Ideal for large-area farmland monitoring, orchard management, pest early warning, water quality inversion, and complex crop classification. Born for efficient, all-weather low-altitude remote sensing.
Born for Large-Area Remote Sensing! Optosky Releases the ATH9600 Multi-Lens UAV-Borne Multispectral Imaging System