
Hyperspectral Wavelength Extraction and Origin Identification Model for Spearmint
author: Callum
2024-09-11
1. Introduction
Spearmint is a crop used for both medicinal and culinary purposes. Its essential oil is widely used as a food additive in flavoring agents for beverages, seafood, milk tea, bread, and other food processing industries. The demand for spearmint is increasing in the market. Despite similar appearances, spearmint from different regions can vary significantly in aroma and nutritional value. This has led to instances of low-quality spearmint being sold as high-quality spearmint from premium regions, disrupting the supply chain and market.
Traditional methods for identifying the origin of spearmint, such as sensory evaluations, are labor-intensive and subjective, leading to unreliable results. Chemical analysis, while accurate, is time-consuming and involves destructive testing. Therefore, there is a growing need for an efficient, non-destructive, and accurate method to determine the origin of spearmint.
Near-Infrared Spectroscopy (NIR), known for its rapid, non-invasive detection, is widely used in food quality assessment. However, as a point-measurement technique, NIR has limitations in spatial resolution, which may restrict its application in analyzing heterogeneous samples. Hyperspectral imaging (HSI), a technology combining spectroscopy and imaging, offers high accuracy, is easy to operate, and provides both spectral and spatial information in a non-destructive manner. HSI has been widely applied in fields such as geology, cultural heritage preservation, medical diagnosis, agricultural product quality assessment, and mineral extraction.
Spearmint
2. Technical Approach and Main Content
Technical Approach:
Acquire experimental materials→ Collect hyperspectral data→ Preprocess hyperspectral images→ Extract characteristic wavelengths→ Build the model
Main Content:
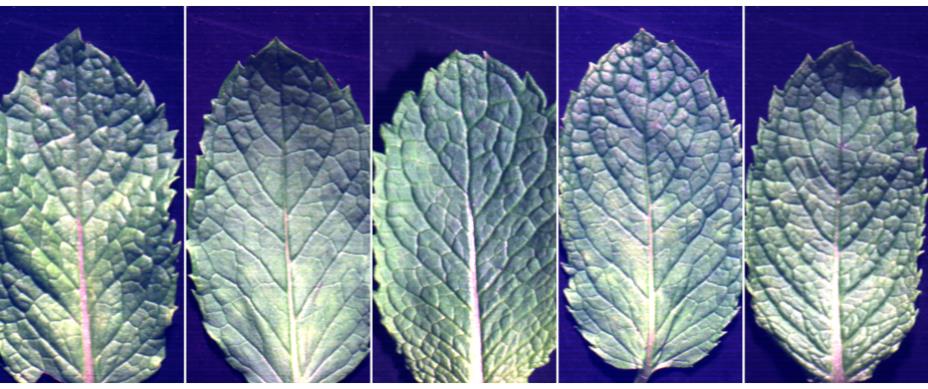
- Sample Collection: The images below show fresh spearmint leaves from five different regions: Xuancheng, Anhui; Beijing; Guangzhou, Guangdong; Zhoukou, Henan; and Shanghai. A total of 375 samples were collected, with 75 leaves from each region. These were selected for their good growth, uniform size, and lack of visible damage. The samples were split into a training set and a test set in a 4:1 ratio, with 300 samples used for training and 75 for testing.
Spearmint Samples from Different Regions
- Hyperspectral Data Collection: Fresh spearmint leaves were laid flat on a conveyor belt for hyperspectral data collection. Before collection, black-and-white calibration was performed to reduce dark current and external light interference. After collection, ENVI software was used for reflectance calibration to obtain reflectance data.
Raw Data Spectra
- Data Processing: The hyperspectral data showed lower signal-to-noise ratios at both ends. Therefore, spectral data in the range of 435.82-961.60 nm was selected. Multivariate scattering correction was applied for smoothing and noise reduction to minimize interference.
Multivariate Scattering Correction Processed Spectra
- Wavelength Extraction: Analyzing the preprocessed data helped identify wavelengths that most clearly differentiate spearmint from different regions. These characteristic wavelengths were then used for final analysis.
- Model Building: Two machine learning models, SVM (Support Vector Machine) and BPNN (Back Propagation Neural Network), were used to build the origin identification model. The effectiveness of the two models was compared.
3. Summary
Hyperspectral Resolution: Hyperspectral imaging technology captures spectral information across hundreds of wavelengths, surpassing traditional multispectral imaging. This extensive spectral data allows for the detection of subtle differences between spearmint from different regions.
No Reliance on Physicochemical Indicators: Hyperspectral imaging extracts characteristic wavelengths directly from spectral data without relying on complex physicochemical indicators. This simplifies the method and avoids uncertainties and limitations associated with measuring physicochemical properties.
Integration with Machine Learning: Combining hyperspectral data with advanced machine learning algorithms, such as SVM and BPNN, enhances classification accuracy and model stability. This integration demonstrates the significant potential of hyperspectral imaging technology in smart agriculture, food quality monitoring, and other fields.
Application of ATH9010 in Monitoring Rice Diseases
Application of ATH9010 in Monitoring Rice Diseases
Related Article

Discover Optosky’s air–ground collaborative hyperspectral solution for mine ecological restoration monitoring. Combining UAV hyperspectral imaging, fixed-point rotating-scan systems, and field spectroradiometers, it supports vegetation, soil, mineral alteration, and water environment monitoring for green mine evaluation and restoration acceptance.
Applications | Hyperspectral Mine Restoration Monitoring
Compare single InGaAs and CMOS+InGaAs detector architectures in hyperspectral imaging. Learn why both can cover 400–1700 nm, how visible-light-extended InGaAs works, and the trade-offs in calibration, spectral registration, and system integration for applications in agriculture, food safety, and industrial inspection.
Technology | Single InGaAs vs. CMOS+InGaAs in Hyperspectral Imaging
Discover how hyperspectral imaging combined with multi-feature fusion (PCA + 2DCOS + CARS) enables non-destructive three-level grading of chili pepper sunburn with 97.2% accuracy. Learn about the ATH3000 system and Optosky's customized solutions for horticultural crop quality inspection and damage classification.
Can Sunburned Chili Peppers Be Non-Destructively Graded? Hyperspectral Imaging ATH3000 Offers a New Answer
Discover the Optosky ATH9600 multi-lens UAV-borne multispectral imaging system—featuring 67° ultra-wide FOV, synchronous snapshot, 3.75 μm large pixel, and native DJI X-Port integration. Ideal for large-area farmland monitoring, orchard management, pest early warning, water quality inversion, and complex crop classification. Born for efficient, all-weather low-altitude remote sensing.
Born for Large-Area Remote Sensing! Optosky Releases the ATH9600 Multi-Lens UAV-Borne Multispectral Imaging System