
Rapid monitoring solution for rice diseases based on drone hyperspectral
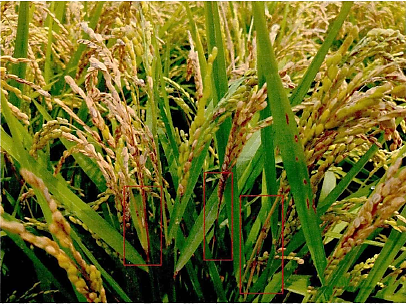
In the process of grain production, agricultural pests and diseases are the primary factors leading to yield losses. Large-scale outbreaks of pests and diseases not only affect farmers' enthusiasm for growing grain, but also restrict the high-quality development of the grain industry. In order to promote the sustainable development of agriculture, increase farmers' income and enthusiasm, and promote agricultural economic development, it is necessary to do a very important job of dynamically monitoring crop growth changes and preventing diseases.
Rice is one of the food crops with the largest planting area in my country. The output of rice is about 400 billion kilograms. Therefore, rice plays a pivotal role in China's food structure. However, due to changes in climate conditions and long-term monoculture of large-scale varieties, the risk of rice diseases is increasing day by day, especially rice blast, which is showing a high incidence trend. As one of the crop diseases and insect pests, rice blast spreads quickly and is difficult to prevent and control. In particular, ear blast has the greatest impact on rice yields. The annual loss of rice due to rice blast is as high as 3 billion kilograms. The most effective prevention and control method for earneck plague is variable pesticide application, and drone hyperspectral remote sensing technology can realize the identification, detection and early warning of the onset of earneck plague.
The current rice detection and control methods based on manual on-site survey and sample plot method can no longer meet the requirements of the increasingly severe situation. The most ideal solution is to accurately identify, monitor and provide early warning for rice blast disease, so as to achieve early detection and early response. . Remote sensing hyperspectral technology can explore the incidence and pathogenesis of crop diseases and insect pests from multiple angles and levels. Based on spectral reflection differences, characteristic corresponding bands, etc., when crops are attacked by pests and diseases, biochemical changes such as chlorophyll, protein, and moisture inside the plant will occur. The composition and intercellular structure will change and be reflected in changes in representation, and these changes in representation will be reflected in different hyperspectral curve characteristics, which can quickly identify the disease and provide prescriptions for variable topdressing and pesticide application. picture. The traditional rice blast monitoring method is mainly based on the experience and judgment of plant protection experts, which is greatly affected by subjective factors, resulting in unreasonable pesticide application, which has a negative effect on the growth and development of rice and damages the ecological environment; compared with traditional detection methods, remote sensing hyperspectral The information obtained is more comprehensive and accurate, and the conclusions drawn are more convincing.
Rice is an annual aquatic herb. The stalks are upright, 0.5-1.5 meters high, depending on the variety. The leaf sheath is loose and hairless; the leaf ligule is lanceolate, 10-25 cm long, extending from the base of both sides into the leaf sheath edge, with 2 sickle-shaped auricles holding the stem; the blade is linear-lanceolate, about 40 cm long, About 1 cm wide, hairless and rough. Rice blast fungus overwinters as conidia and mycelium on rice straw and rice. The following year, conidia are produced and spread to rice plants by wind and rain. They germinate and invade the host and spread to adjacent cells to form a central diseased plant. The conidia formed in the diseased area are spread by wind and rain for reinfection. Sowing infected seeds can cause seedling blast. The disease spreads rapidly under conditions of continuous rain, insufficient sunshine, sometimes sunny and sometimes rainy conditions, clouds and fog in the morning and evening, and condensation. After infection, as the germs multiply and cause damage, the ear neck nodes become necrotic, and the nutrient channels transported to the ear are blocked, resulting in white ears or shriveled rice ears. Once the panicle neck is infected with rice blast, it will cause varying degrees of yield reduction. The characterization of different disease levels is shown in the table below.
|
Disease level |
Representation |
Picture |
Features |
|
Healthy |
No symptoms |
|
The wheat ears are full, the branches and stems are upright, and there are no brown spots. |
|
Mild disease |
1/3 of the branches and stems are affected |
|
Brown dots gradually appear on the rice stems and spread to the branches. |
|
Poisoning diseases |
Neck or spindle disease |
|
The spread range increases, infecting the connection between rice ears and stems. |
|
Severe disease |
Incidence of panicle neck, grain loss or even white ears |
|
The fruit is not full and may even produce white ears. |
Table 1 Description of symptoms of ear blast disease at different levels
Technical ideas and main content
Optosky uses nationally produced hyperspectral imagers and ground object spectrometers to monitor the status of rice ear blast disease. It mainly obtains imaging hyperspectral data through a near-ground drone platform and combines it with ground object spectrometers to establish a database of ear blast disease levels. Rice disease detection based on deep convolutional neural network extracts disease distribution information and performs sensitive band analysis. Finally, based on the PNN probabilistic neural network algorithm, it achieves accurate detection of different incidence levels of panicle neck blast and realizes rice disease identification and detection as variables of rice. Provide decision-making suggestions on medication, field management strategies, etc. The specific technology roadmap is shown in Figure 2.
Figure 2 Flowchart of ear and neck plague monitoring technology
What needs to be implemented:
1) Real-time monitoring of rice disease distribution, area, and quantity based on UAV hyperspectral data collection, analyzing spectral characteristics, identifying key disease areas, and conducting investigations.
2) Use a ground spectrometer to sample and measure key areas, establish a sample database of rice panicle blast, and then use continuum removal, SG smoothing filtering and other related analyzes to screen sensitive characteristic bands to form a rice panicle blast band library to obtain a more complete Monitoring statistical information on the incidence of ear blast in different stages of rice.
3) Use the deep convolutional network model to extract a wide range of spatial and temporal distribution information of rice. Based on the PNN probabilistic neural network algorithm, establish a correlation model between hyperspectral data and the severity of rice diseases and insect pests. By inputting the canopy spectral data, you can obtain the rice disease situation in the study area. , realize variable pesticide application, and provide a theoretical basis for yield quality management and planting planning in the agricultural sector.
4) The drone flies once a month. Based on long-term sequence monitoring image data, it can timely understand the changing trends of rice field planting distribution, area, and disease quantity in a county or city, thereby providing a reference for accurate monitoring.
Technical points
Automatic Extraction of Rice Fields With the development of computer science and artificial intelligence technology, convolutional networks have become a research hotspot in image segmentation and pattern recognition. It continuously performs convolution calculations through each convolution layer, and independently extracts data from rich images. Features are learned from training samples for image segmentation. This end-to-end processing model effectively improves the accuracy and speed of image segmentation. The convolutional neural network is also more advantageous in solving the discontinuity problem caused by block boundaries. It can better solve the problem of insufficient discrimination between the rice spectrum and the background spectrum, and it still has good performance in more complex scenes. Image interpretation capabilities and robustness. Therefore, the automated extraction of rice fields this time is implemented using a convolutional neural network model. The specific schematic diagram is shown in Figure 3 below.
Figure 3 Roadmap of automated rice extraction technology
Convolutional neural network is a feedforward neural network that contains convolutional calculations and has a deep structure. It is one of the most commonly used representative algorithms of deep learning. It uses deep convolution to simulate the hierarchical perception and local receptive fields in the human visual perception mechanism to process some unstructured data and integrate low, medium and high different levels of features in an end-to-end manner, thereby Obtain rich feature information and improve the accuracy of semantic segmentation of remote sensing images. The basic structure of a convolutional neural network generally includes a data input layer, a convolution layer, a pooling layer, a fully connected layer and an output layer. Its basic model framework is shown in Figure 4.
Figure 4 Basic model framework of convolutional neural network
When using convolutional neural networks to perform different ground object classification tasks, you can build a suitable network model according to specific purposes and needs, or you can use the existing classic network models at this stage. Currently, the YOLOv7 network model is used for target detection of forest pests and diseases. . YOLOv7 (You Only Look Once) was proposed by Ultralytics LLC in July 2022. The official version of YOLOv7 is more accurate than YOLOv5 at the same size, 120% faster (FPS), and 180% faster (FPS) than YOLOX. In the range of 5FPS to 160FPS, YOLOv7 exceeds the currently known detectors in both speed and accuracy, and was tested on GPU V100. The model with an accuracy of 56.8% AP can reach 30 FPS (batch=1) The above detection rate, at the same time, this is the only detector currently that can still exceed 30FPS with such high accuracy. The network model structure is shown in Figure 5.
Figure 5 YOLOv7 network model
Vegetation various index spectra
In order to better extract rice information and reduce the probability of misclassification, the original spectrum can be used to construct various spectral indices, as shown in Table 2.
|
Vegetation index name |
Calculation formula |
|
|
GI |
Greenness index |
R544/R677 |
|
SIPI |
Structure insensitive pigment index |
(R800-R445)/(R800-R680) |
|
NPCI |
Normalized total pigment chlorophyll index |
(R680-R430)/(R680+R430) |
|
MSR |
Modified simple ratio index |
(R800/R670-1)(R800/R670+1)^1/1 |
|
NRI |
Nitrogen reflectance index |
(R570-R670)/(R570+R670) |
|
PRI |
Photochemical reflectance index |
(R570-R531)/(R570+R531) |
|
TCARI |
Transformed chlorophyll absorption in reflectance index |
3*[(R700-R670)-0.2*(R700-R550)*(R700/R670)] |
|
PSRI |
Plant senescence reflectance index |
(R800-R445)/(R800-R680) |
|
PHRI |
Physiological reflex index |
(R550-R531)/(R550+R531) |
|
ARI |
Anthocyanin reflectance index |
(R5300^(-1)-(R700)^(-1) |
|
TVI |
Triangle vegetation index |
0.5*[120*(R750-R550)-200*(R670-R550)] |
|
RVSI |
Red edge vegetation stress index |
(R712+R752)/2-R732 |
|
MCARI |
Modified chlorophyll absorption reflectance index |
[(R701-R671)-0.2*(R701-R549)]/(R701/R671) |
|
ARVI |
Atmospherically resistant vegetation index |
[R800-2*(R700-R436)]/[R800+2*(R700-R436)] |
|
DVI |
Difference vegetation index |
R800-R700 |
|
EVI |
Enhanced vegetation index |
2*(R800-R700)/(R800+6*R700-7.5*R436+1) |
|
GNDVI |
Greenness normalized difference vegetation index |
(R546-R700)/(R546+R700) |
|
LMI |
Leaf moisture index |
R1650/R830 |
|
OSAVI |
Optimize soil adjustment vegetation index |
[(R800-R700)/(R800+R700+0.16)]*(1+0.16) |
|
NDVI |
Normalized difference vegetation index |
(R800-R700)/(R800+R700) |
|
RVI |
Ratio vegetation index |
R800/R700 |
|
SAVI |
Soil adjustment vegetation index |
1.5*(R800-R700)(R800+R700+0.5) |
|
SLAVI |
Special leaf area vegetation index |
R800/(R700+R800) |
|
VARI |
Visualized atmospheric resistance index |
(R546-R700)/(R546+R700-R436) |
|
YI |
Yellowness index |
(R580-2*R630+R680)/2500 |
|
WBI |
Water band index |
R950/R900 |
Table 2 Vegetation index table
Program implementation
Hyperspectral drone flight service
Hyperspectral reflects the characteristics of high-resolution optical information, which uses many very narrow electromagnetic wave bands (usually <10nm) to obtain relevant data from objects of interest. Hyperspectral images are acquired by an imaging spectrometer, which provides tens to hundreds of narrow-band spectral information for each pixel, producing a complete and continuous spectral curve. Image information can reflect the external quality characteristics of the sample such as size, shape, defects, etc. Since different components have different spectral absorption, the image will have a more significant reflection on a certain defect at a specific wavelength, and the spectral information can fully reflect the sample. Differences in internal physical structure and chemical composition. Therefore, hyperspectral characteristics can be used to identify rice panicle blast monitoring with different disease levels, and combined with drones, efficient monitoring of large-area rice fields can be achieved.
Figure 6 UAV hyperspectral image composed of 300 bands
UAV hyperspectral has the following characteristics:
There are many spectral features. The imaging spectrometer has 300 bands in the visible and near-infrared spectral regions;
High spectral resolution. The sampling interval of the imaging spectrometer is small, and the resolution is less than 3nm. Fine spectral resolution reflects the subtle characteristics of the spectrum of ground objects;
Data is abundant. As the number of bands increases, the amount of data increases exponentially. It can provide spatial domain information and spectral domain information, that is, "unification of images and spectra", and the spectral curve obtained by the imaging spectrometer can be compared with the spectral curve of similar ground objects measured on the ground.
1.Comparison with visible light results
Visible light images only consist of light information in the three bands of red, green and blue (RGB). When identifying rice, it is monitored through artificial naked eye interpretation, which is inefficient and has limited accuracy. The hyperspectral image results have 300 bands of light information. For rice, its exclusive band characteristics can be extracted to accurately identify it. At the same time, combined with machine learning/deep learning algorithms, automated monitoring can be achieved.
2.Comparison with multispectral results
The main difference between multispectral and hyperspectral is the number and narrowness of the bands. Multispectral images usually consist of 10-30 bands of light information. They have limited detection features for rice or other ground objects and are easily confused with the reflection spectra of other ground objects. Having a higher level of spectral detail in hyperspectral images can provide better vegetation discrimination capabilities. For example, when detecting rice, hyperspectral images can effectively distinguish rice from other similar plants and improve accuracy.
①Multispectral images usually refer to 10 to 30 bands expressed in pixels, and each band can be obtained by using a remote sensing radiometer.
②Hyperspectral images contain very narrow bands (<10 nm), and hyperspectral images have hundreds of bands (for example, ATH9010 has 300 bands). Preparatory stage.
(1)First, configure drones and other equipment that meet project needs according to project requirements, and prepare a take-away configuration list, as shown in Table 3.
|
No |
Product |
Model |
quantity |
|
1 |
Hexacopter UAV |
ATPL606 six-rotor drone |
1 |
|
2 |
hyperspectral imager |
ATH1010 hyperspectral imager |
1 |
|
3 |
Standard reflective whiteboard |
50cm*50cm |
4 |
|
4 |
Drone power battery |
32000mAh high voltage lithium battery |
3 |
|
5 |
Device power battery |
Get power from drone |
|
|
6 |
Data collection host |
Use onboard computer |
|
|
7 |
Data processing workstation |
12th generation i7/48G/1T or above solid state drive |
1 |
|
8 |
Data storage and processing disk |
Several blocks above 1T |
1 |
|
9 |
tool kit |
Hexagon socket screw set |
1 |
|
10 |
onboard computer |
ASUS PN63 Desktop NUC Micro Computer |
2 |
|
11 |
Onboard computer screen |
13.3 inches, 2k, Sharp original IPS screen, full touch screen |
1 |
Table 3 Hyperspectral configuration list of a single UAV
(1) After the drone is debugged in the company, the external equipment should be packed according to the configuration list and confirmed that nothing is missing;
(2) Conduct preliminary survey and planning of the hyperspectral drone flight operation area based on the key distribution map of rice diseases extracted from satellite remote sensing monitoring, including route design and field flight time planning. According to the measurement area range and flight zone overlap requirements, set the corresponding flight parameters in the drone remote controller and plan the flight zone. The hyperspectral camera uses push-broom imaging, so there is no course overlap parameter (the minimum value of course overlap is set), only side overlap.
(3) Determine the flight service date based on project requirements and weather conditions;
Implement flight collection
In the planned research area, hyperspectral images are collected according to needs. Specific steps are as follows:
(1) UAV side settings: Assemble the UAV hyperspectral equipment, set the altitude and speed, and set the image route spacing according to the camera parameters and image overlap requirements;
(2) Camera side settings: Set the camera frame rate according to the altitude and speed, and set the integration time (exposure time) according to the whiteboard measurement value;
(3) Standard reflectivity whiteboard: Place a standard reflectivity whiteboard in the route area, and the whiteboard needs to be captured when collecting images.
Figure 7 Schematic diagram of UAV hyperspectral data collection
UAV hyperspectral image processing
After collecting UAV hyperspectral image data, the following preprocessing work is required:
(1) Wavelength calibration: The original image collected does not have wavelength information, and a wavelength calibration file needs to be added;
(2) Image cropping: Hyperspectral uses push-broom imaging, which requires cropping of the collected images of the measurement area;
(3) Registration and splicing: perform geo-registration or relative registration on the cropped survey area images, and then splice the registered images into a complete image;
(4) Radiation correction: The value in the original image represents the reflection intensity, which needs to be corrected using the whiteboard reflection value and standard reflectance to calculate the reflectance of the entire image.
(5) Mixed spectral decomposition: The spectral data collected by drones are affected by the spatial resolution of the image, resulting in a pixel that may be mixed and averaged by different ground objects or vegetation. In order to improve the accuracy, a mixed spectral decomposition operation needs to be performed on the image;
(6) Spectral filtering (smoothing): There is a certain amount of noise in the spectral information in the original image, and spectral filtering needs to be performed before application.
Spectral image processing software interface:
Figure 8 Schematic diagram of UAV hyperspectral image processing software interface
Ground object sample data collection
Optosky uses nationally produced hyperspectral imagers and ground object spectrometers to conduct on-site surveys. The purpose is to provide real training samples for on-site classification models and test samples for classification results for the classification of UAV remote sensing images. The main content of the on-site investigation is to measure the spectral data of rice infected with ear blast, and classify all the spectral data of ear blast rice collected by the ground object spectrometer into different levels of infection as a standard training for UAV hyperspectral image data processing Sample data set.
Figure 9 Schematic diagram of ground object spectrometer equipment and data collection
Rice target detection results
First, a ground spectrometer is used to collect spectral data of diseased rice, and then statistical and correlation analysis is performed to determine the sensitive band of the rice, classify the disease level, and then corresponding to the hyperspectral band range, establish a deep learning training sample library, and conduct volume testing. The cumulative neural network algorithm is trained, and the specific results of automatic rice identification are shown in the figure.
Figure 10 Regional detection results of different rice disease levels
Figure 11 Variable pesticide application prescription chart
Application Case | Application Of ATH3500 Hyperspectral Imager In Rapid Wheat Year Identification
UAV-based hyperspectral poppy rapid monitoring solution
Related Article
