
Spectroscopy - A Journey in Search of Clean Water
author: Susan
2024-09-20

Bottled and tap water samples
In the United States and other developed countries, drinking water—whether from a local municipality tap or from a manufacturer bottled at the source—is carefully regulated, widely available, and often taken for granted. Using the ATP3330 high-resolution spectrometer, we were curious to measure a few samples to determine any spectral differences.
We started with a few samples of bottled water from a local grocery store. First up: spring water. "Spring water" comes from the groundwater layer from which water flows naturally to the Earth's surface. The composition of these spring water samples appears to vary (sometimes dramatically) depending on which facility they came from (Fig.1).
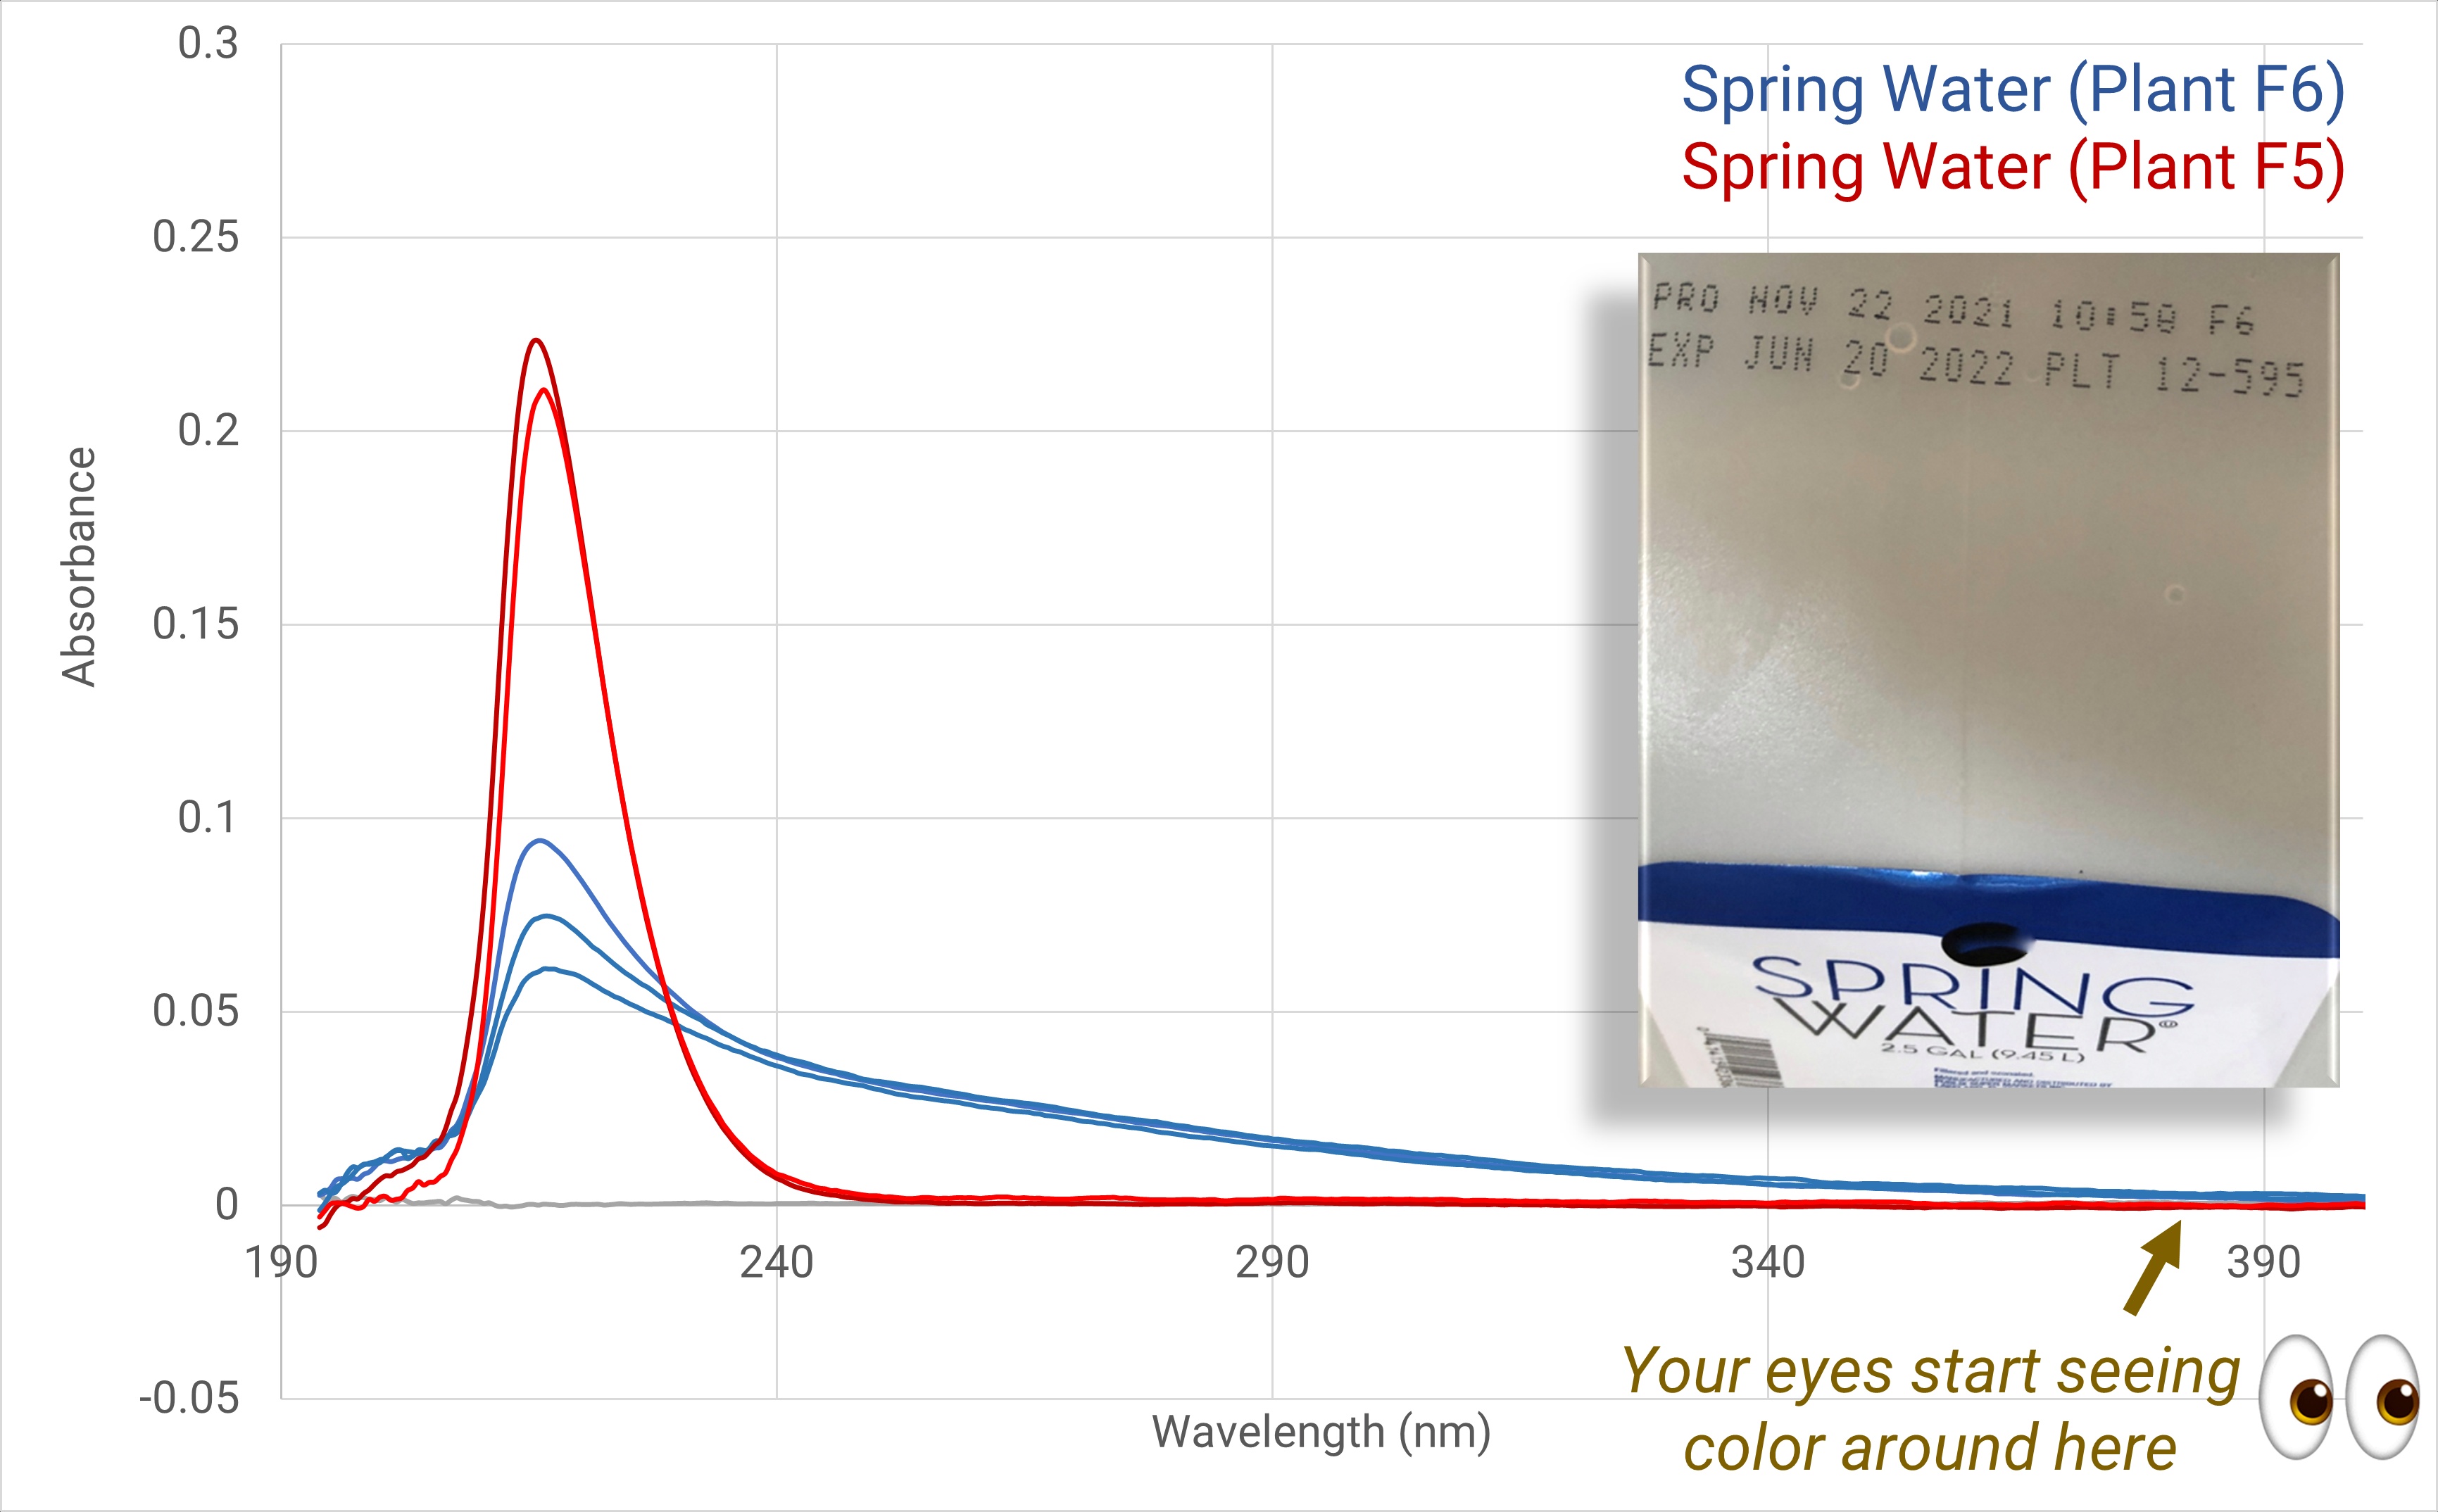
Fig.1. Grocery store brand spring water
We next measured drinking water, which is the name of the water used in beverage or food preparation. Our drinking water samples from the same grocery store showed more UV spectral activity (Fig.2) than spring water, suggesting that more dissolved solids and/or organic matter may be present.
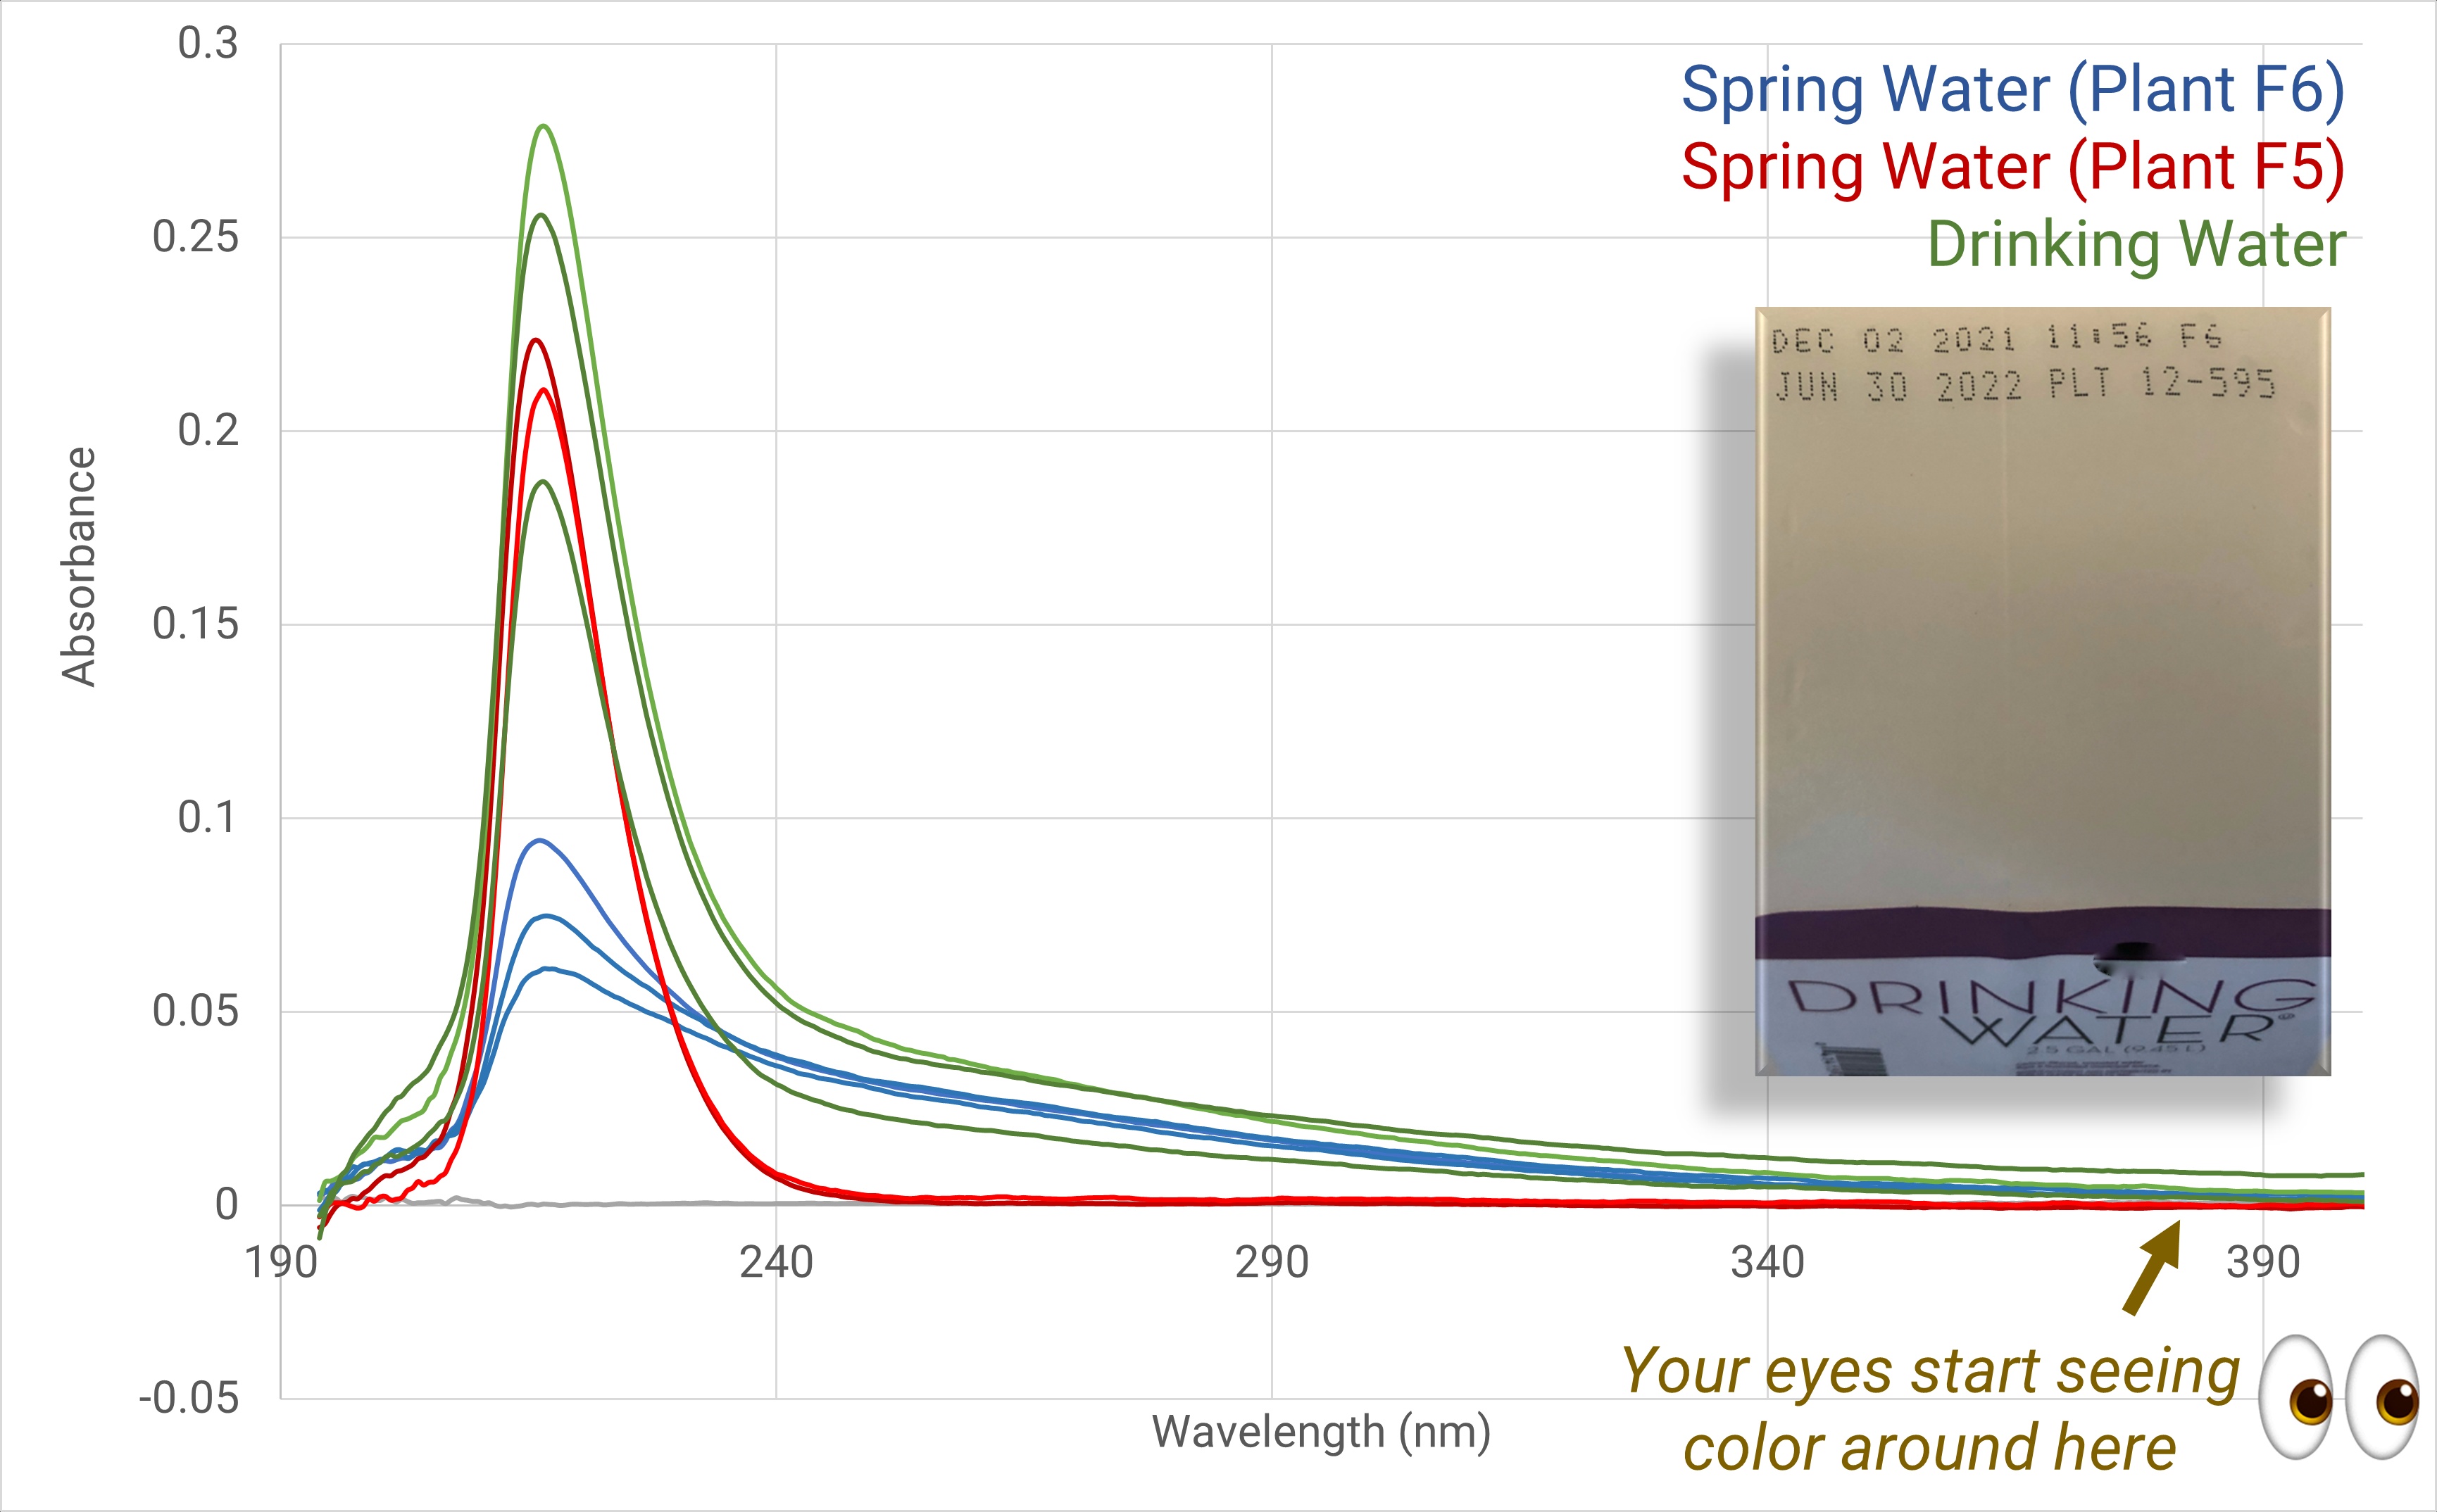
Fig.2. Grocery store brand drinking water
For comparison, we also tested local tap water samples. It has a lower UV peak than bottled water, but shows more activity at 240-290 nm (Fig.3). This can be caused by the addition of water treatments such as fluoride and trace contaminants in the pipes that carry the water from the treatment facility.
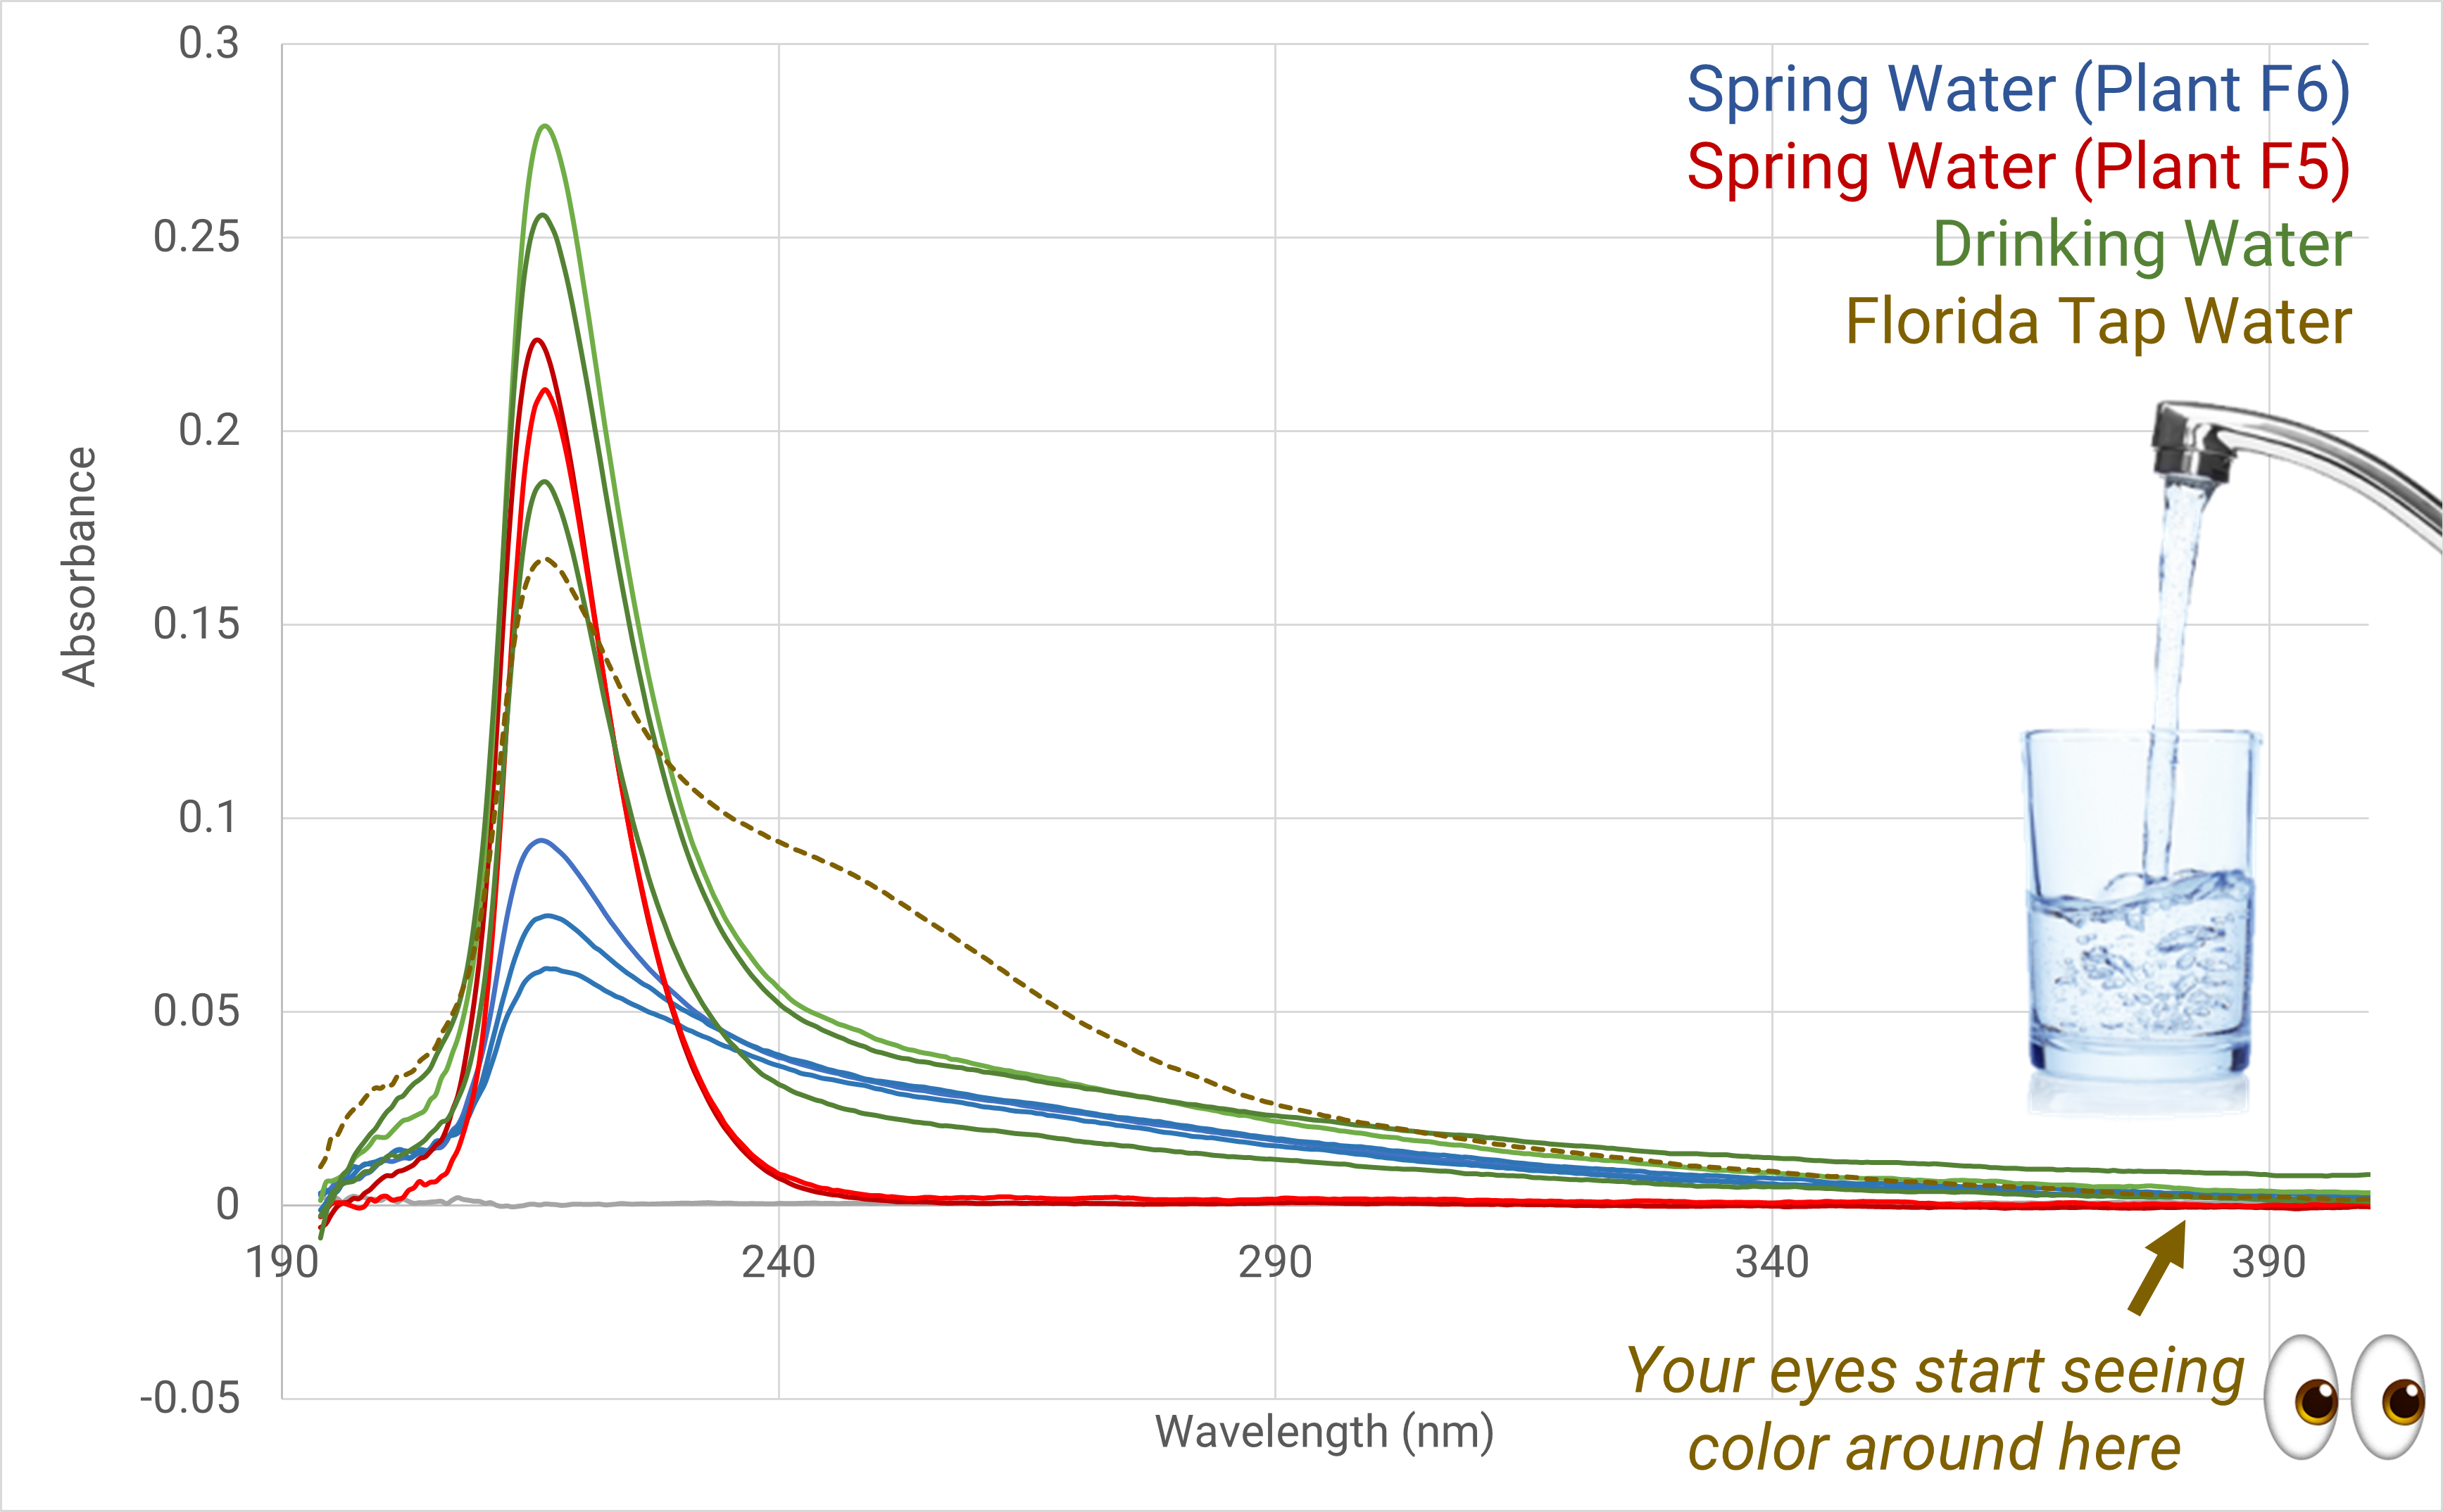
Fig.3. Municipal (tap) water
To complete our survey of regulated water sources, we measured a sample of expensive bottled water brands. While this water costs about 6 times the cost of a case (24) of 16.9 oz (500 ml) bottles, the expensive brand samples we tested had spectral signatures very similar to store brand spring water samples (Fig.4). Consumers don't seem to mind the extra cost -- according to some sources, top bottled water brands have annual sales in the billions.
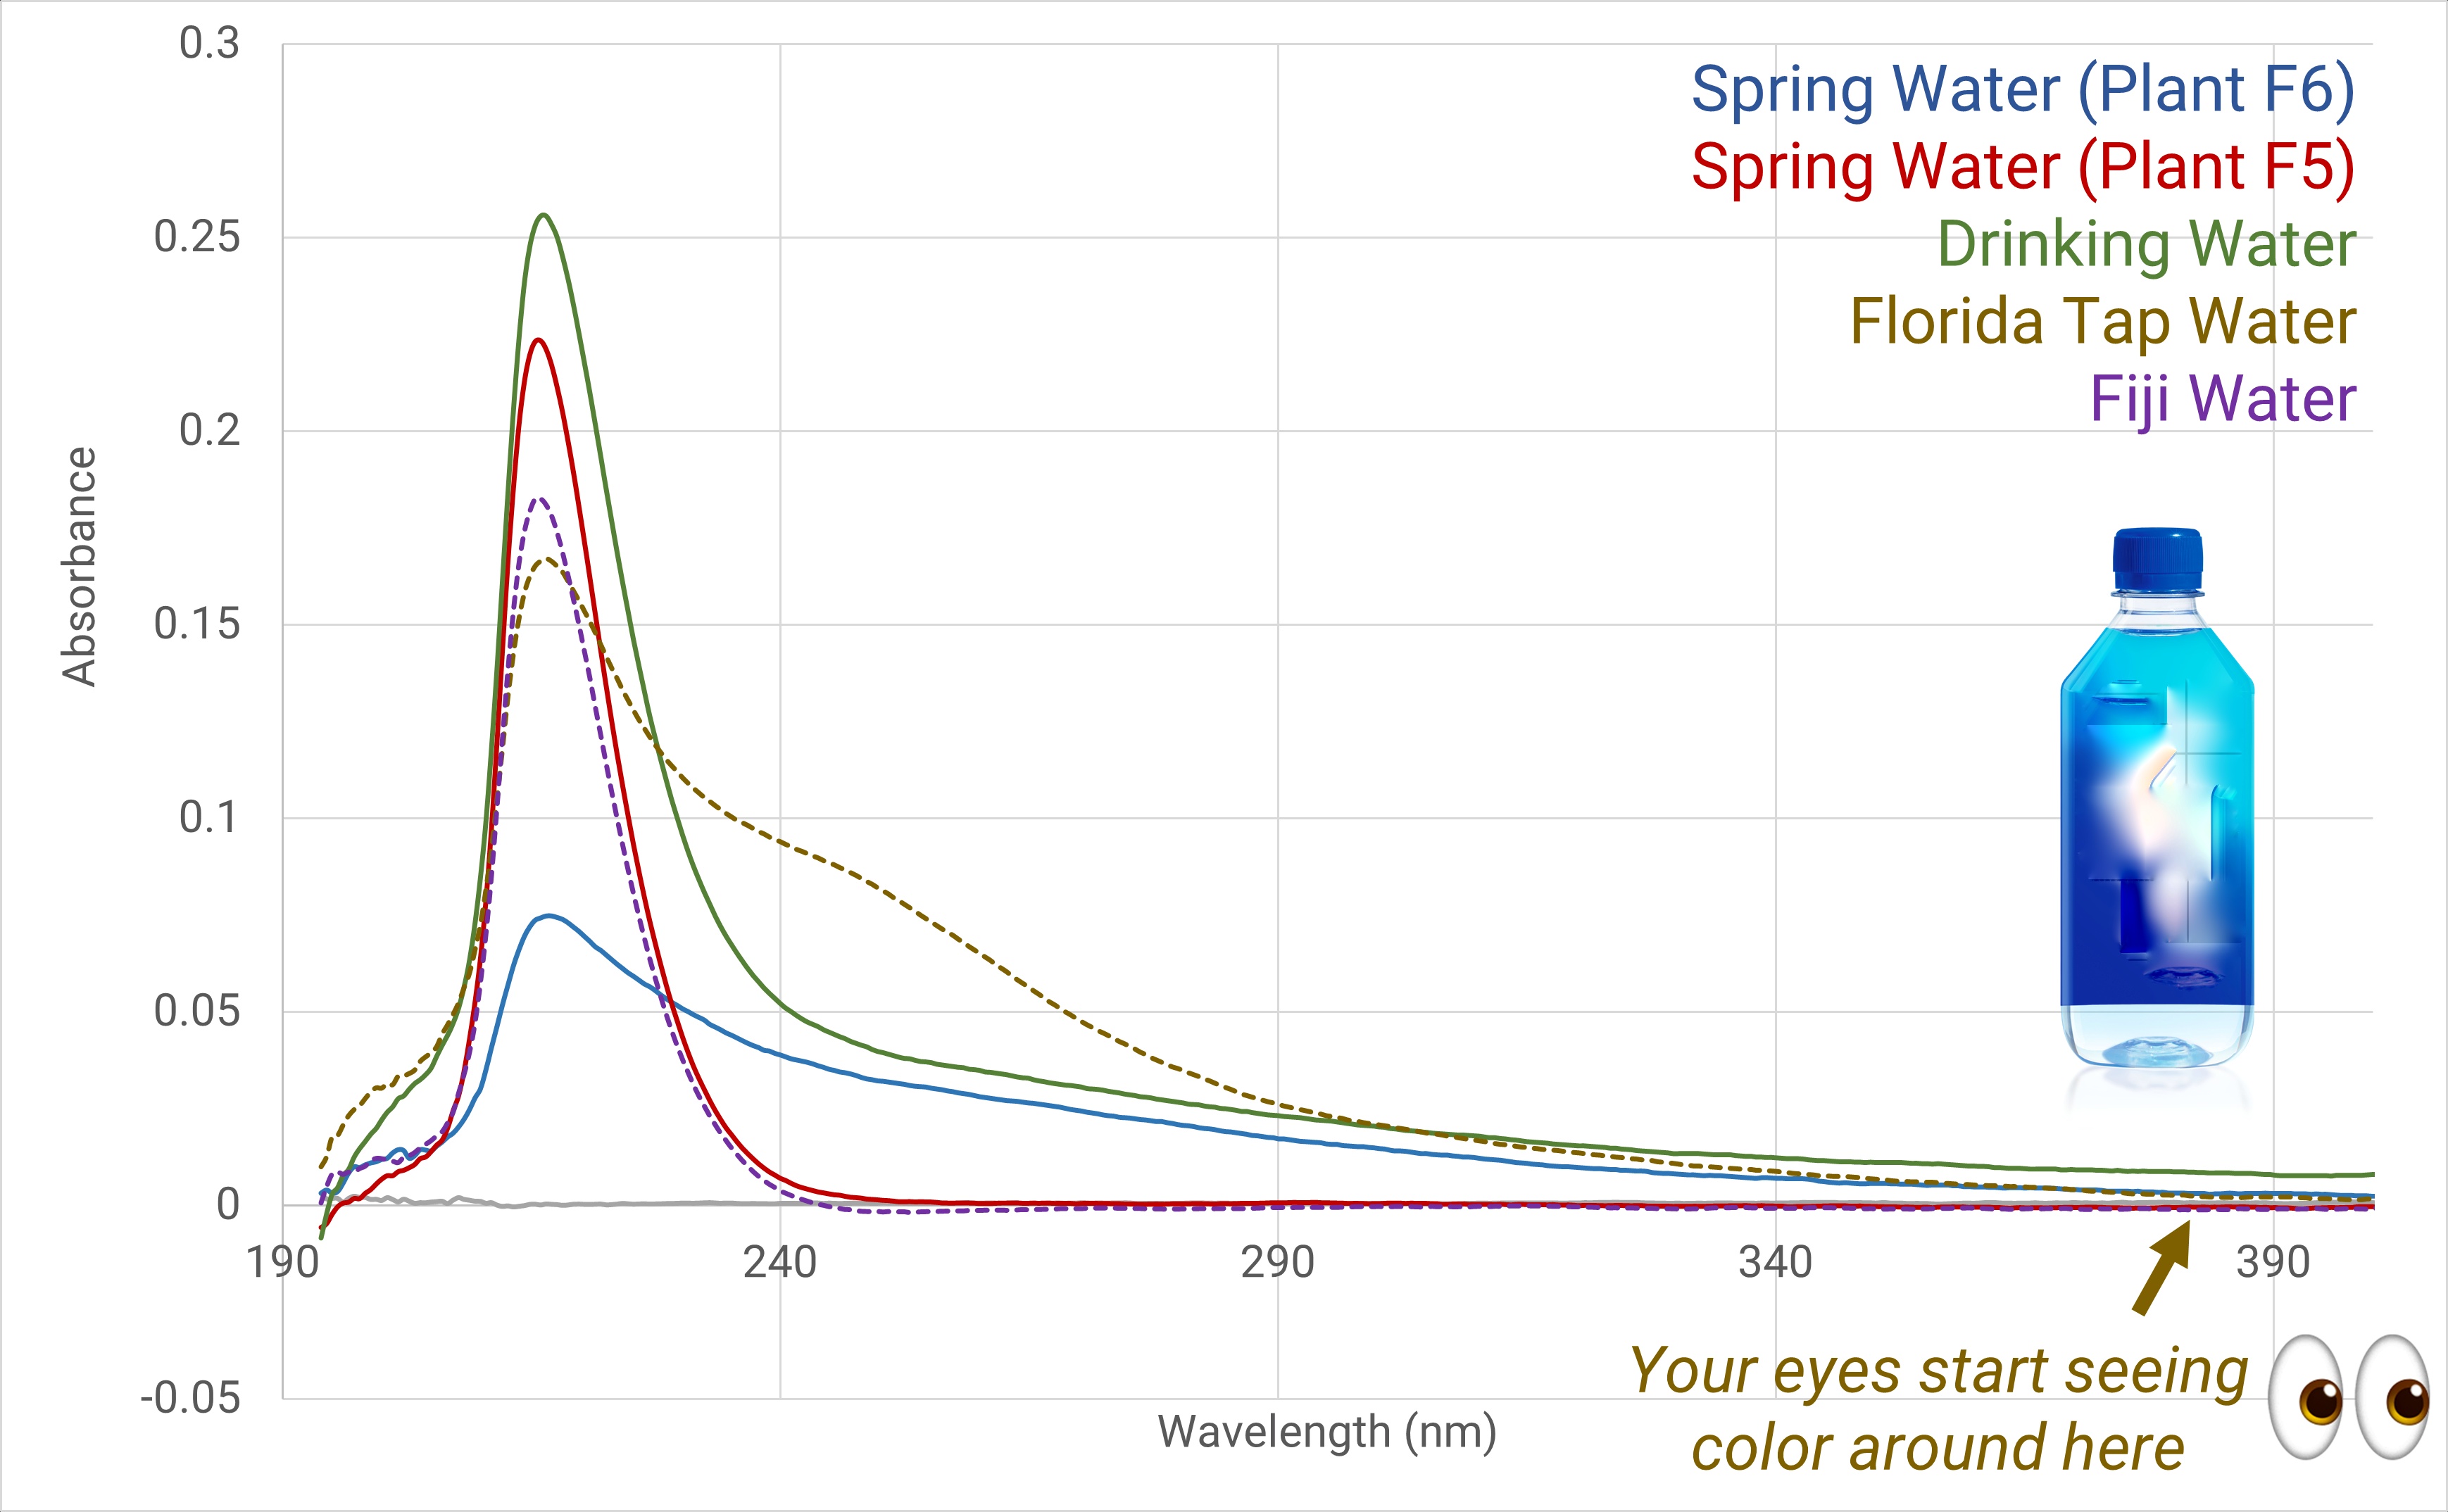
Fig.4. High-end bottled water
Snowmelt, ground snow, and lake water samples
To better understand the water quality (or lack thereof) experienced by many people in less developed countries, the researchers also tested surface water from two different regions of the United States, in two very different area. In the Pacific Northwest, snowmelt (Fig. 5) and ground snow (Fig. 6) collected at or near the Spokane Mountains in Washington State were tested. For background, Mount Spokane has an elevation of nearly 6,000 feet and averages about 163 inches (413 cm) of snowfall per year. It is about 35 miles from Spokane, a city of about 220,000. Interestingly, the Spokane Mountain water samples were spectrally very similar to grocery store spring and drinking water samples.
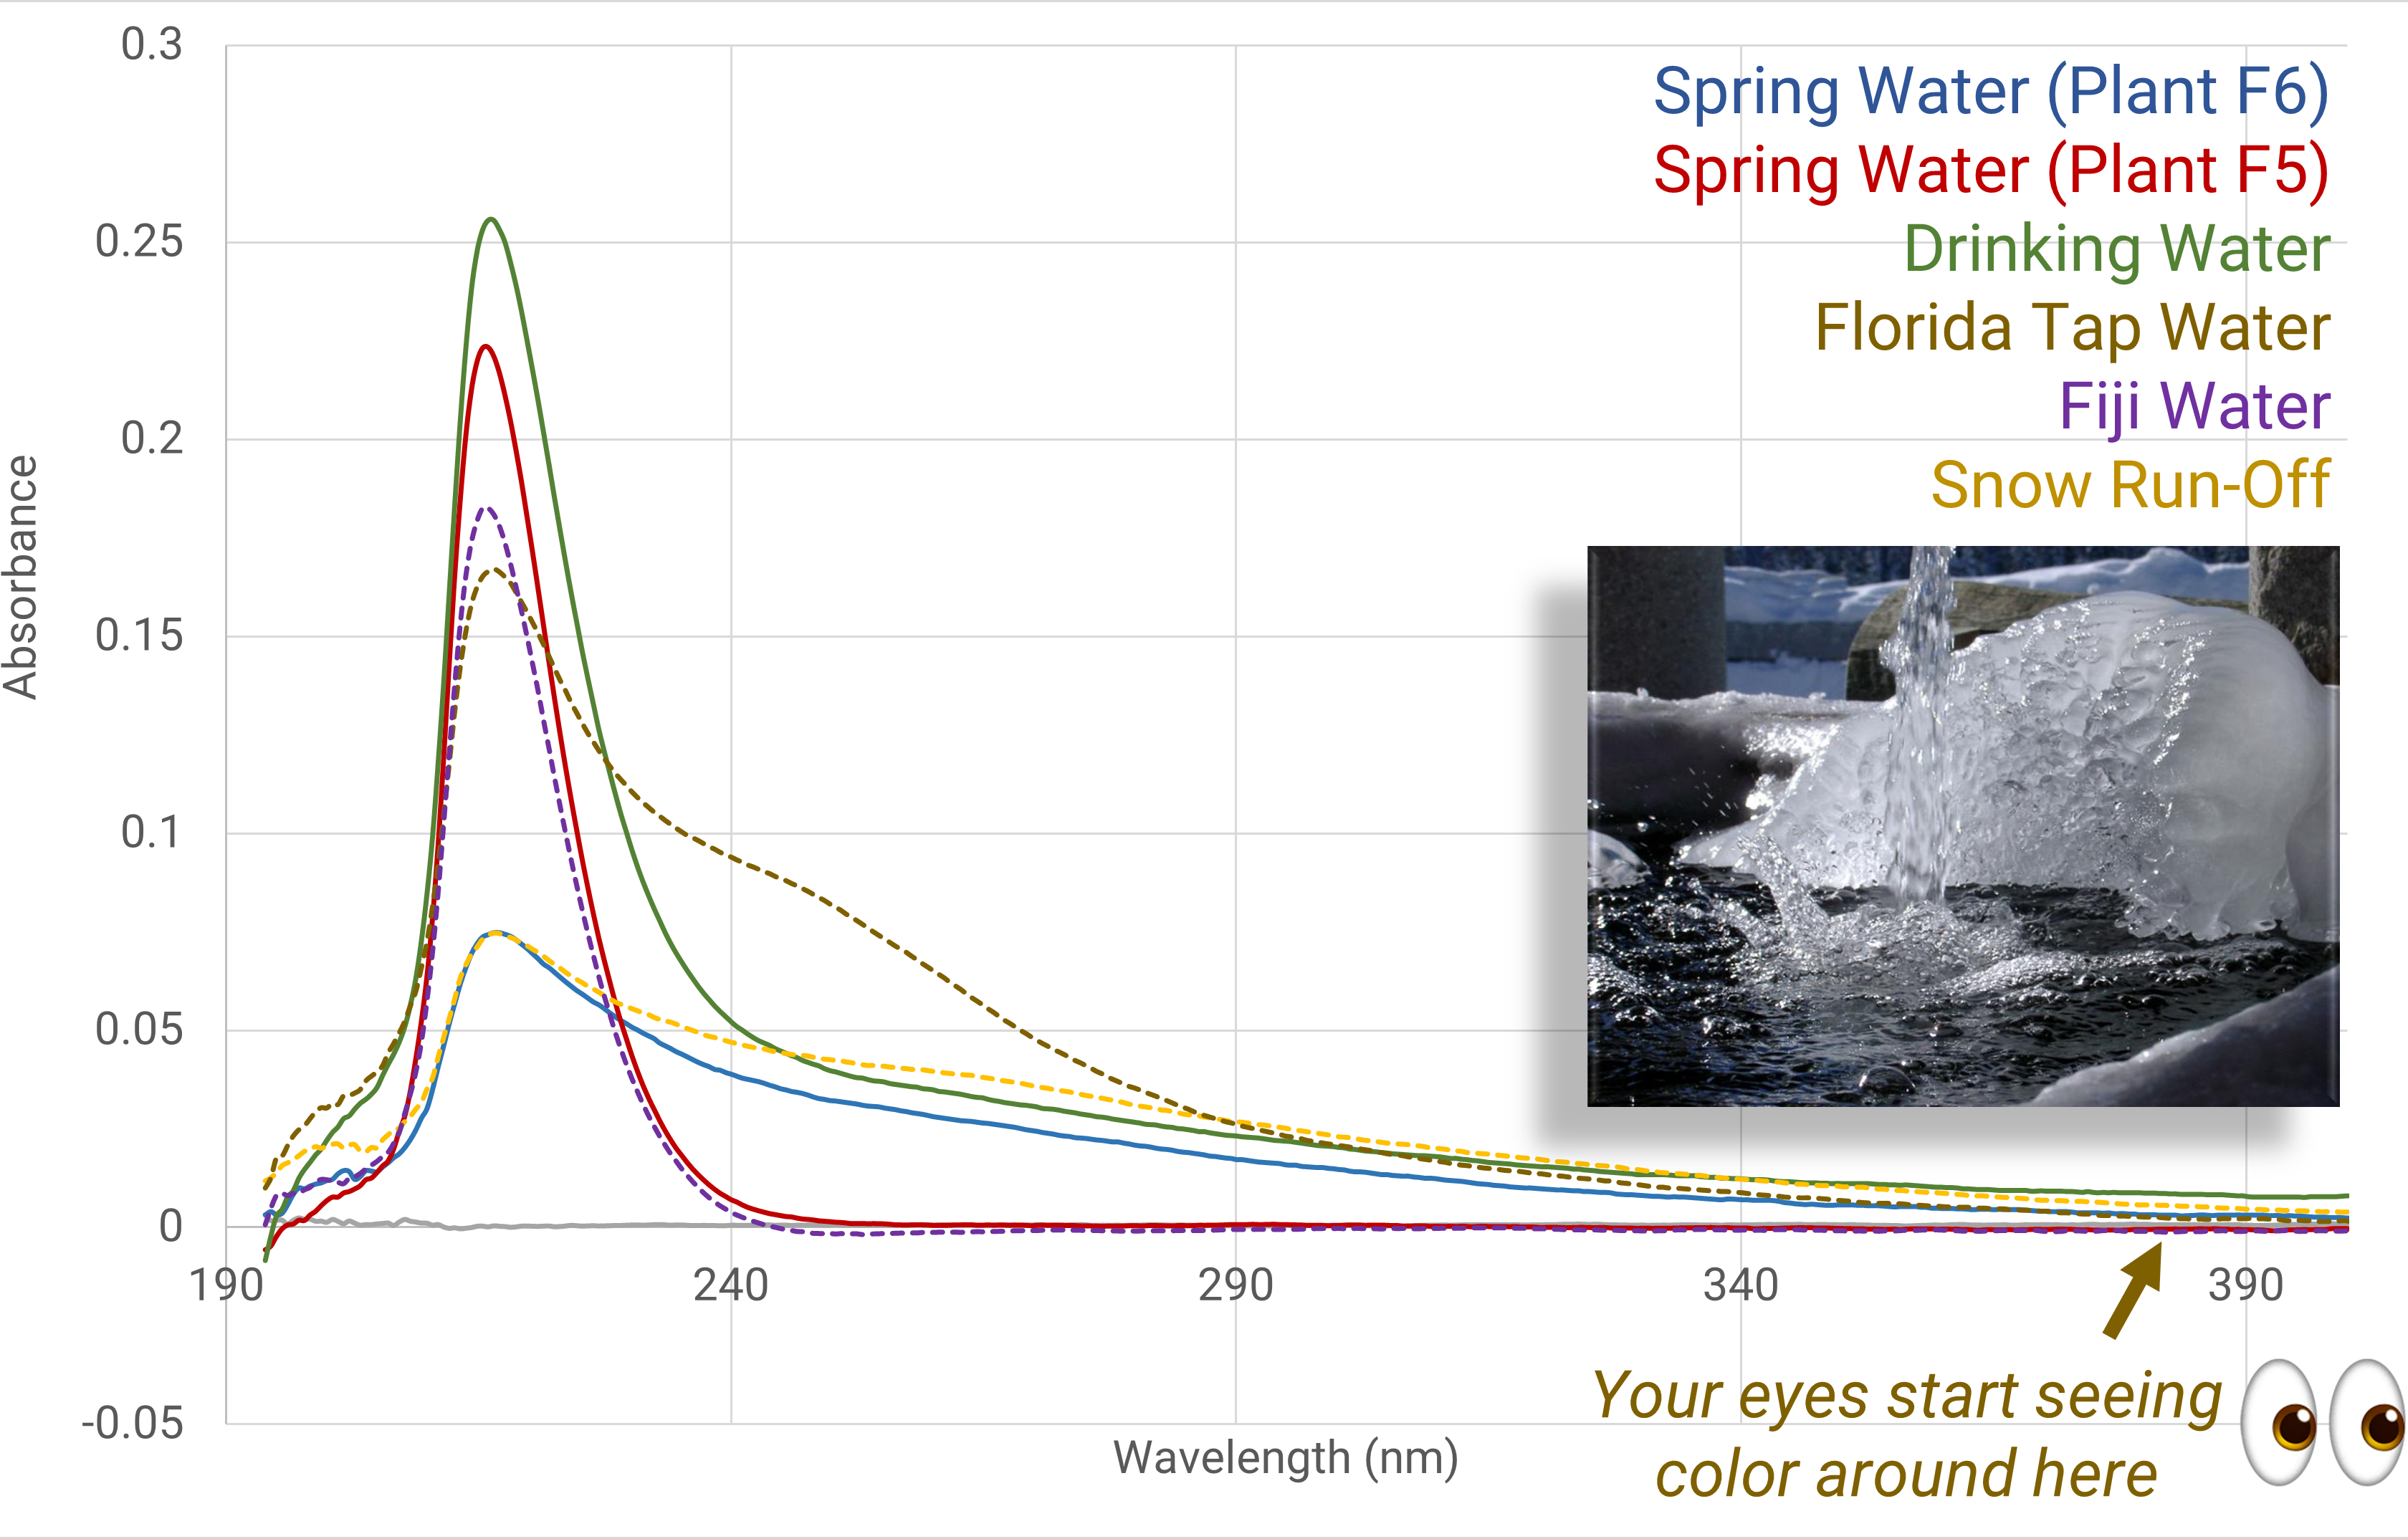
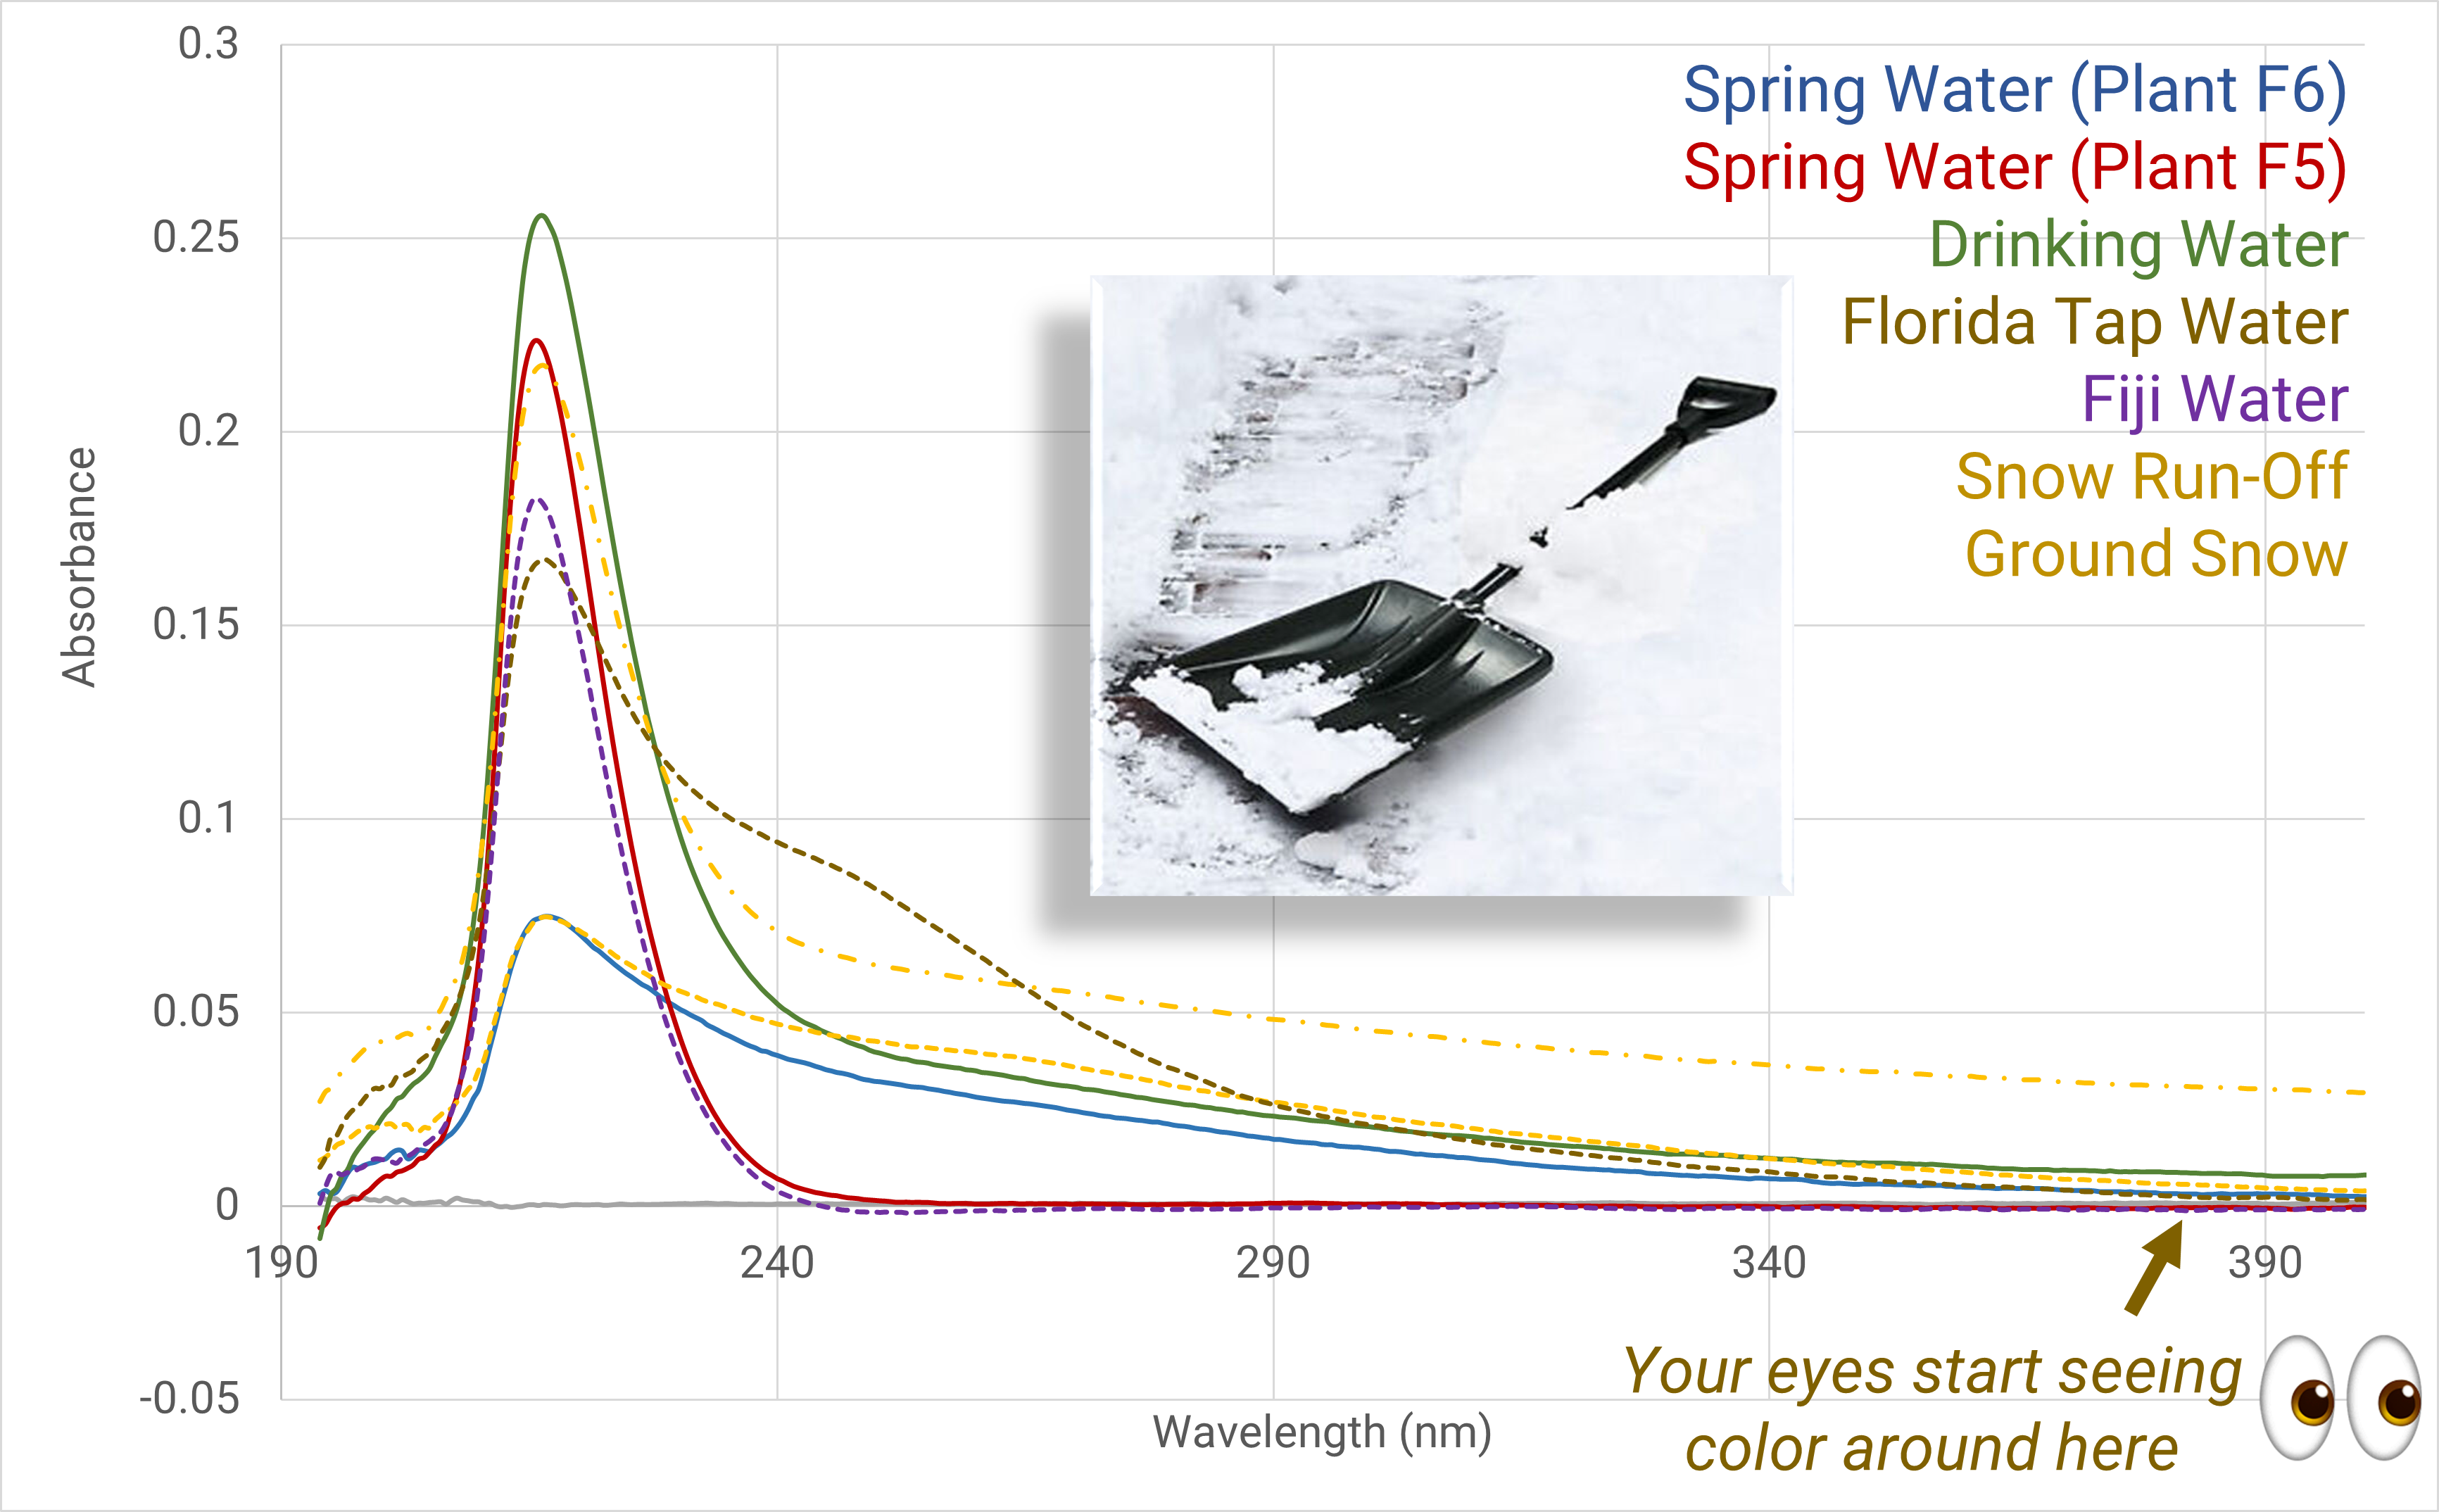
Fig.5. Snowmelt Fig.6. Ground snow
In contrast, the samples we collected from lakes had such a strong response to UV light that the spectrum was off-scale (Fig. 7), indicating contaminants. Only when we rescaled the results did we fully appreciate the huge difference (Fig.8). This level of water quality is similar to, and in many cases better than, the only water available to nearly a billion people around the world.
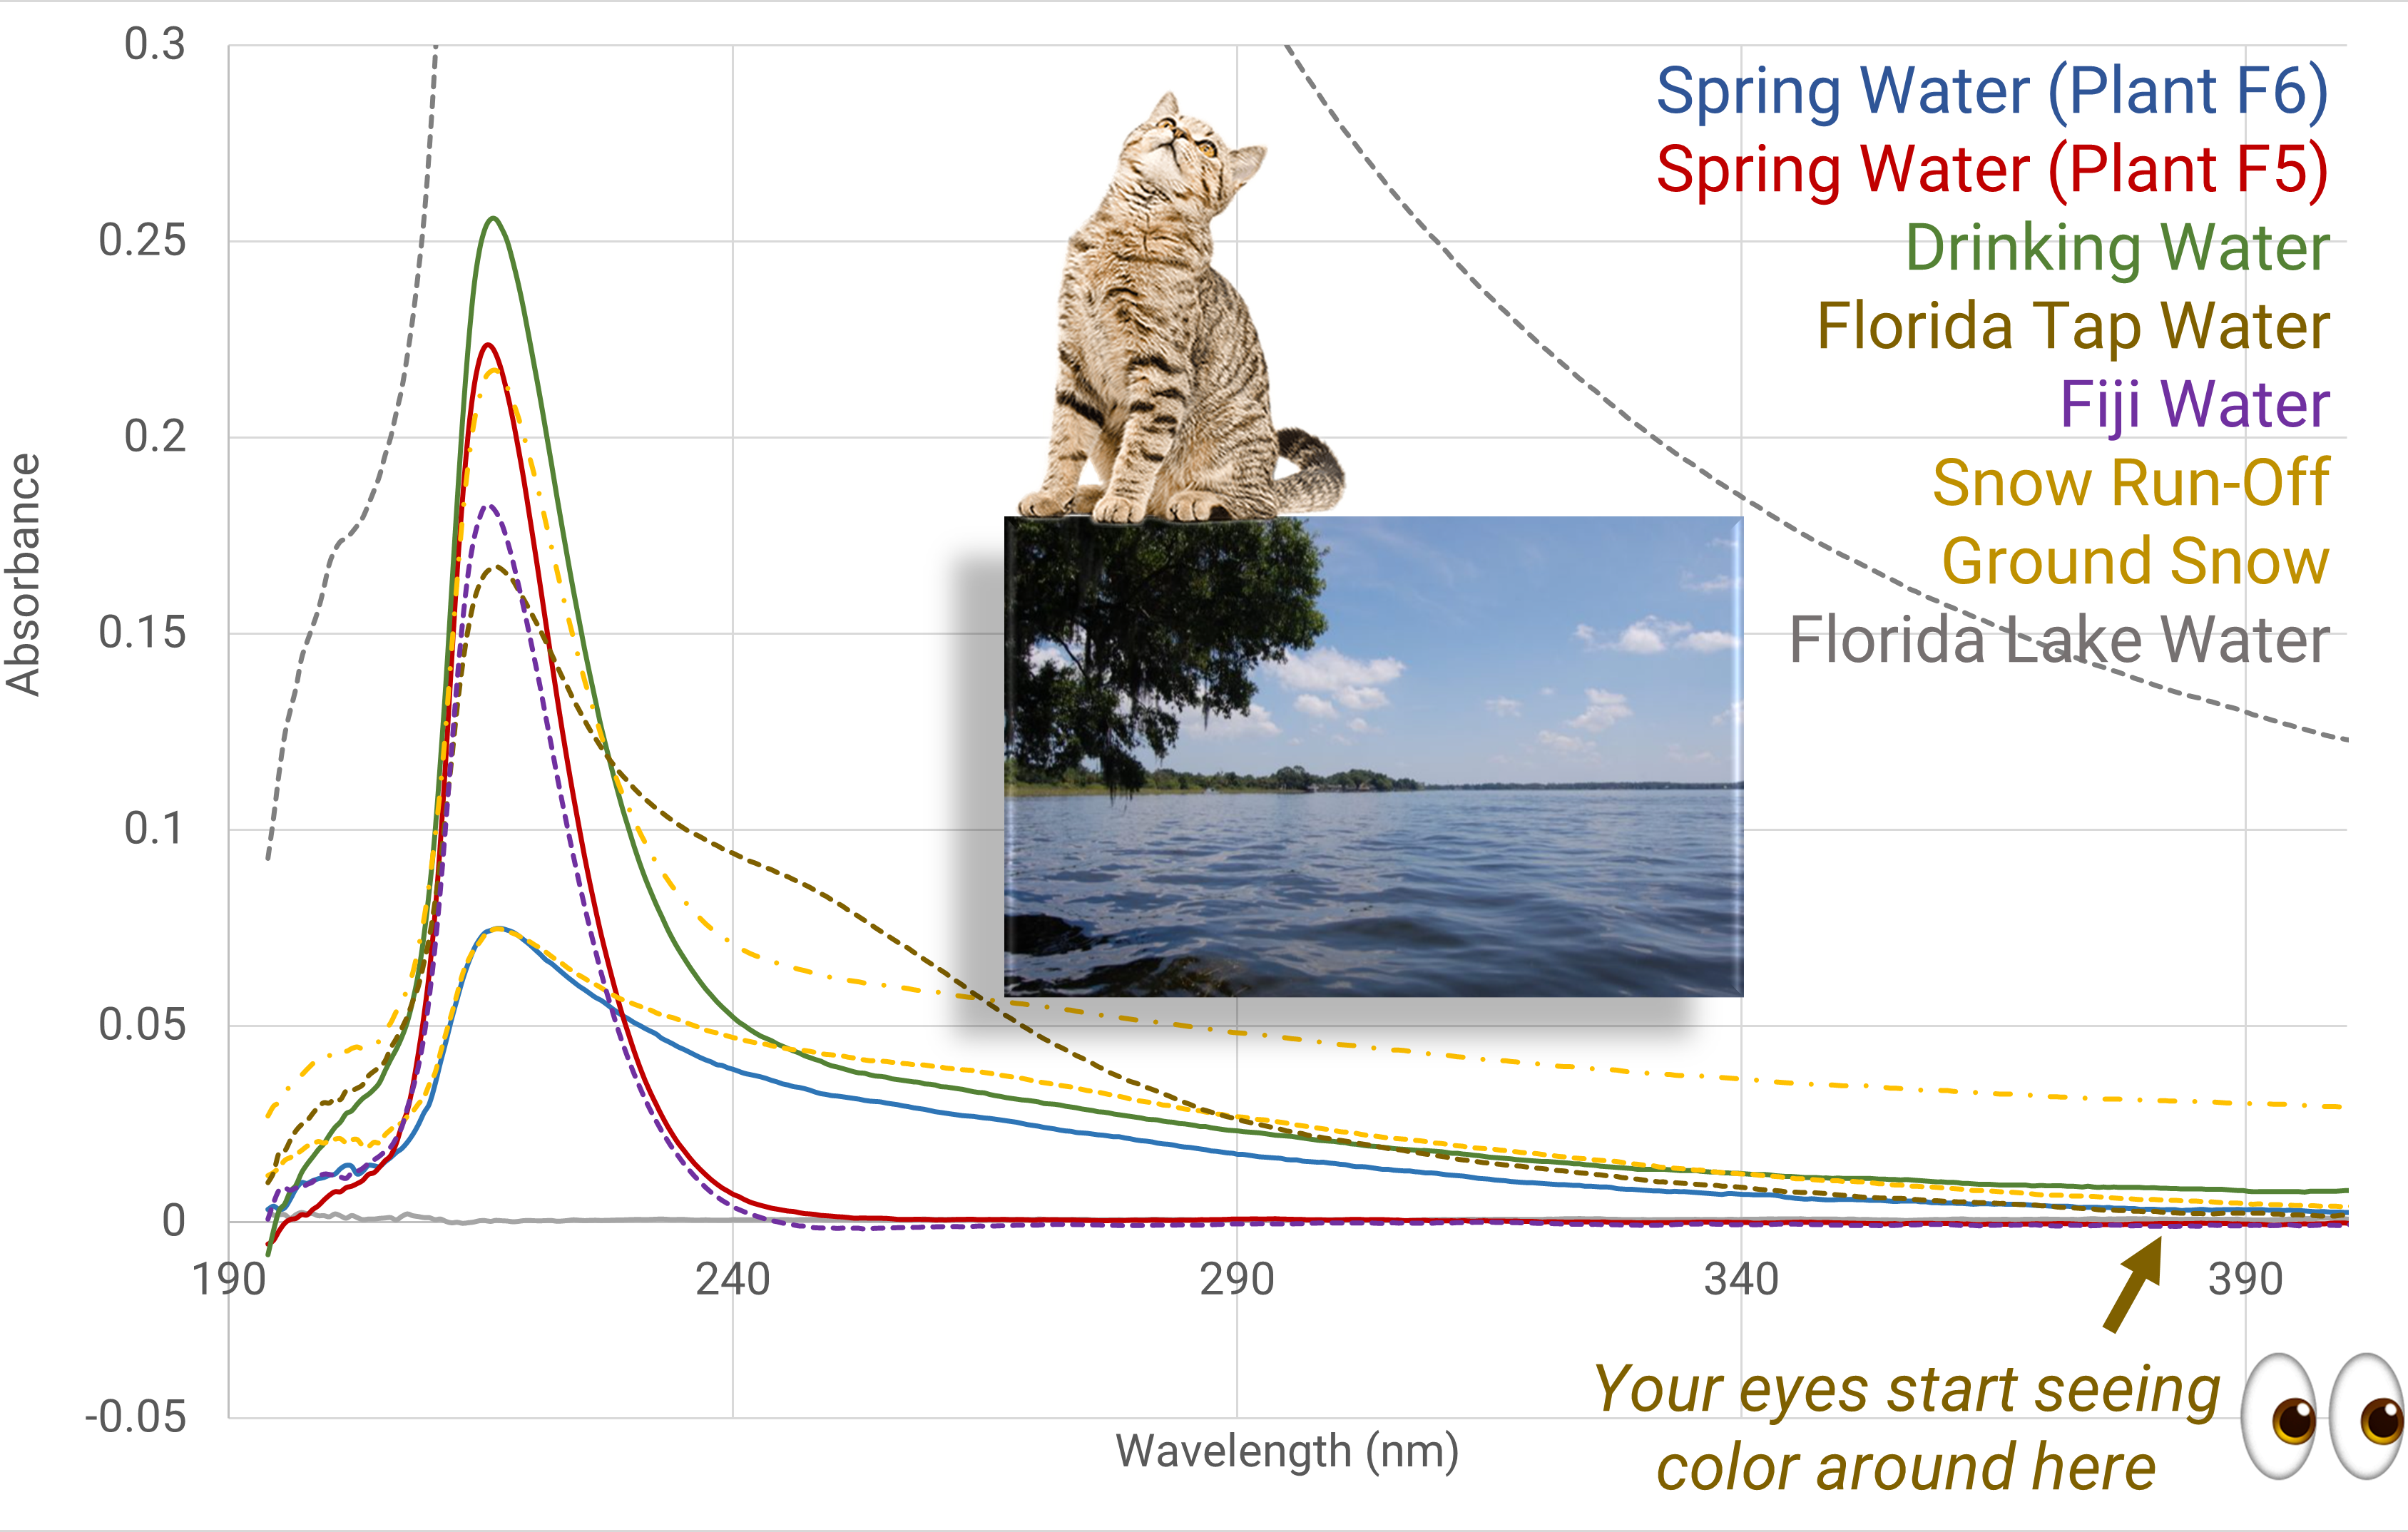
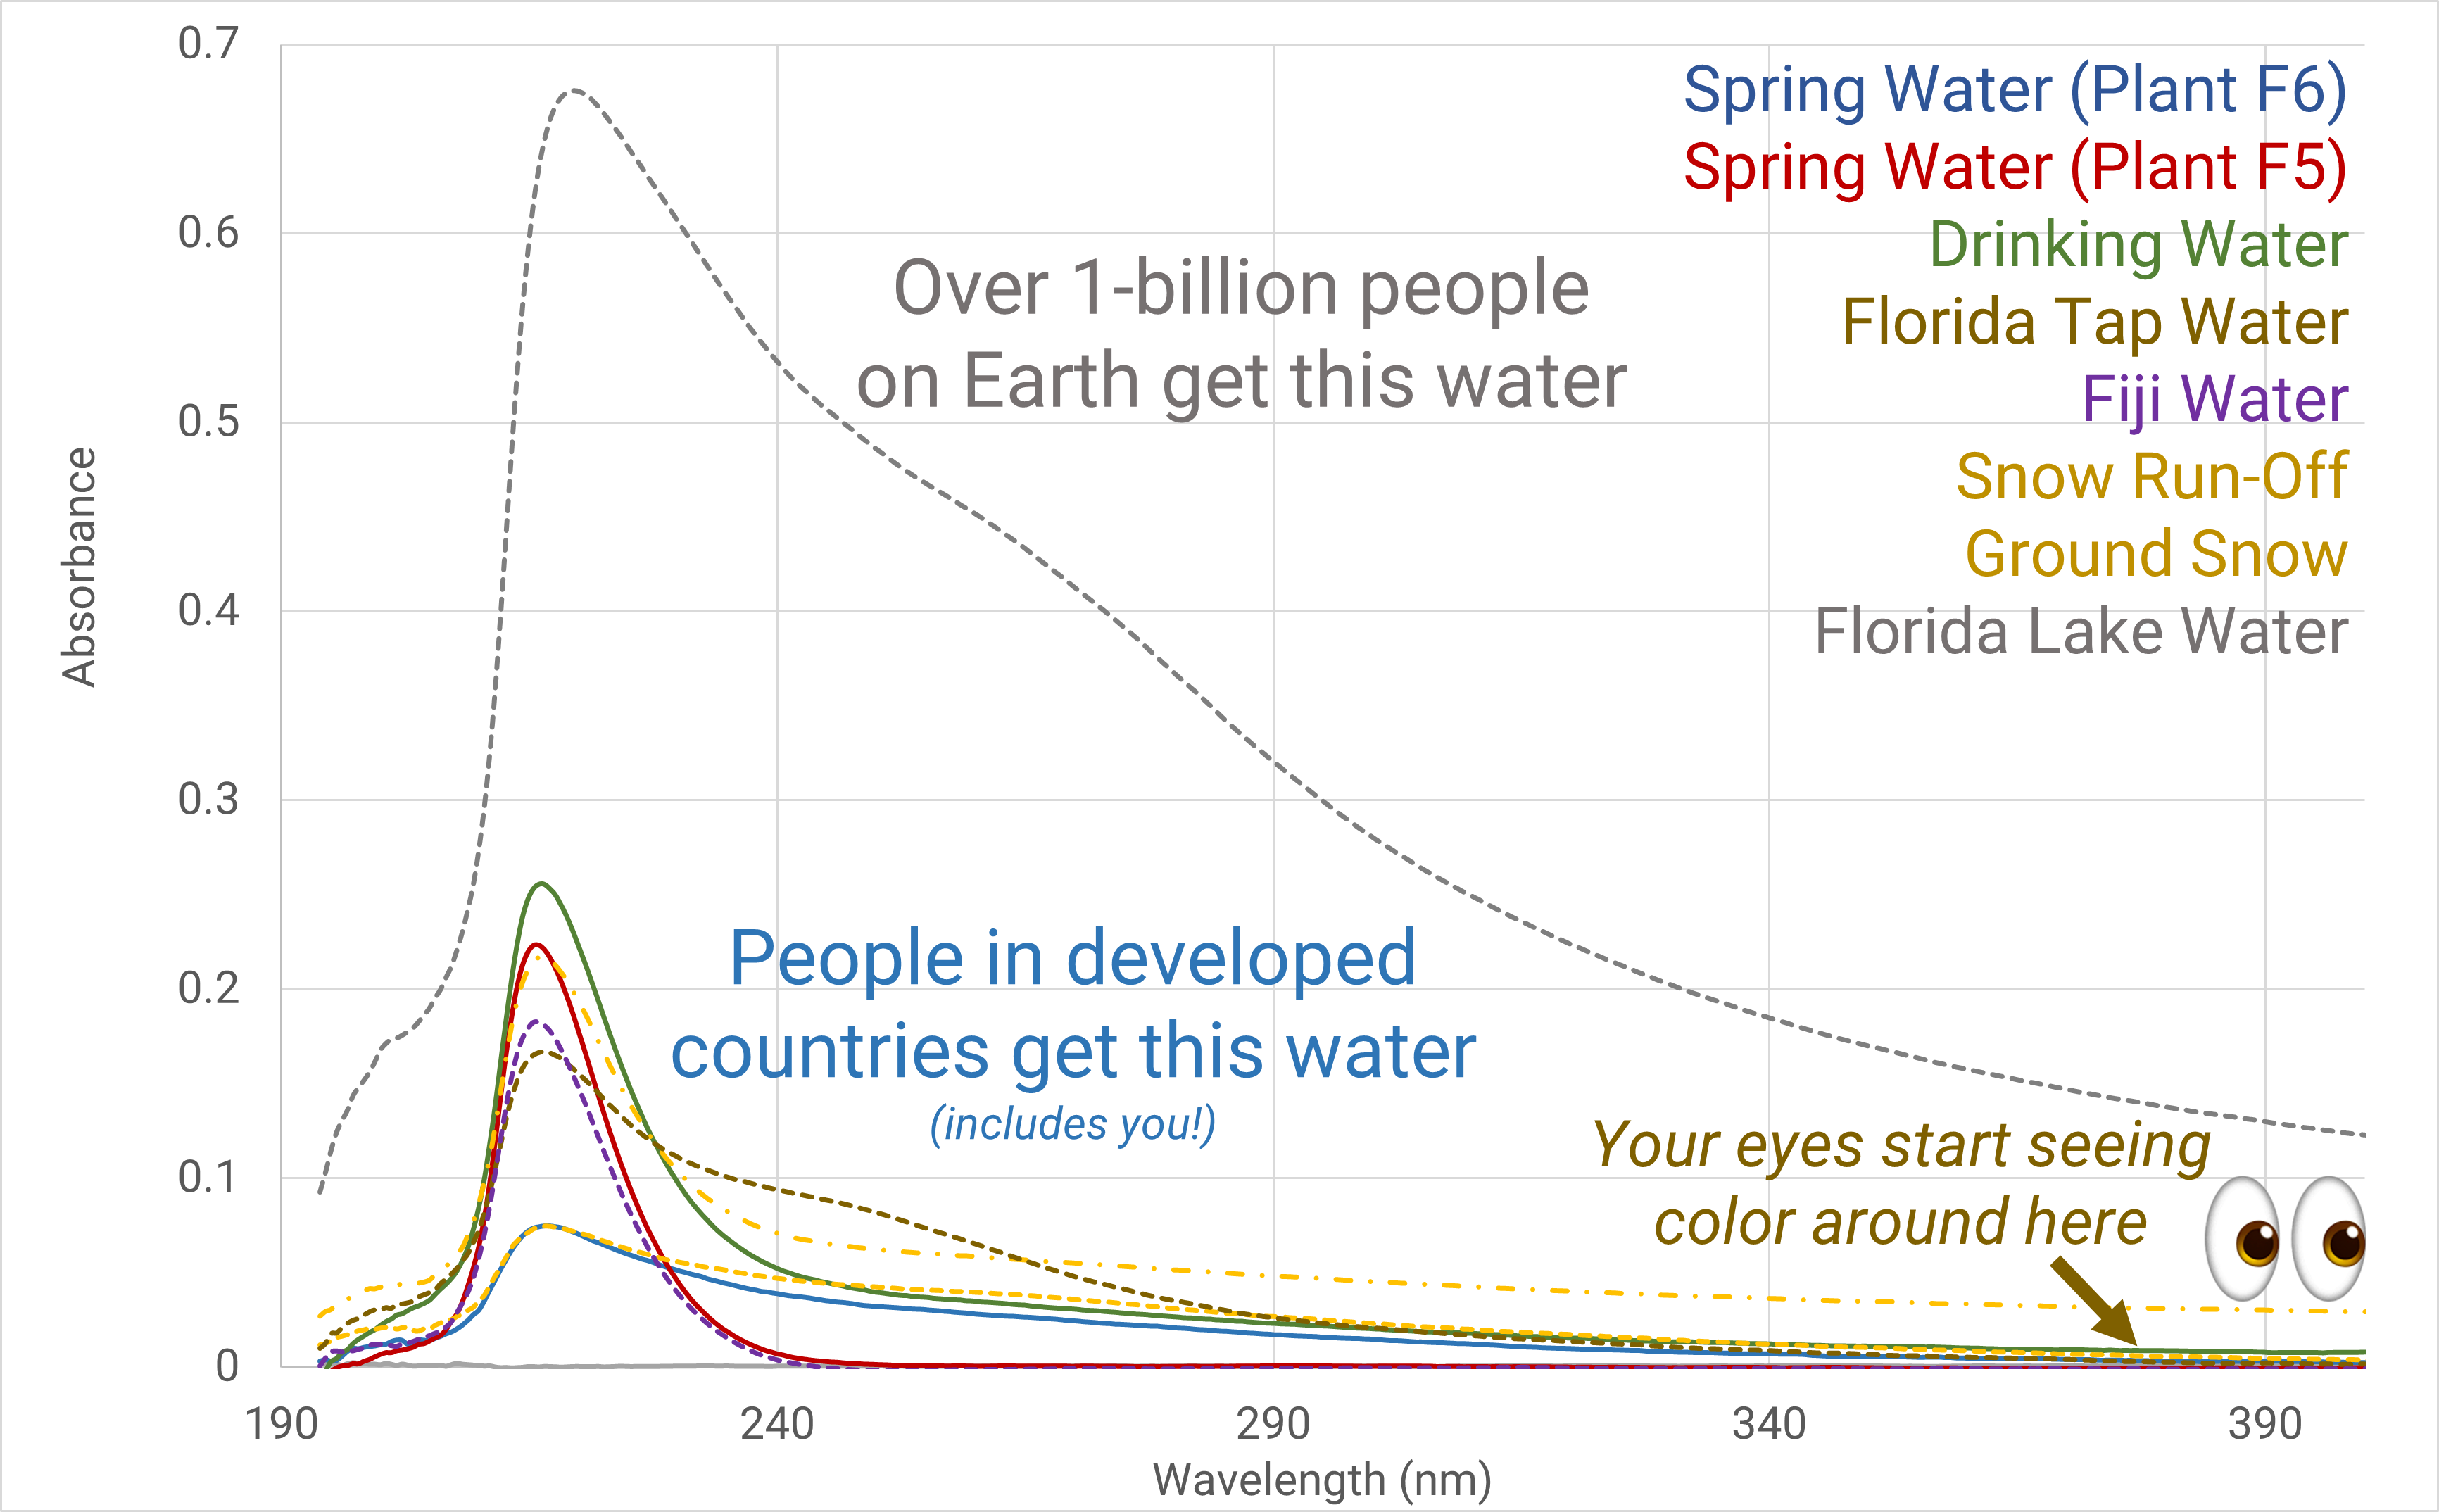
Fig.7. Lake water Fig.8. All water samples
Related Products
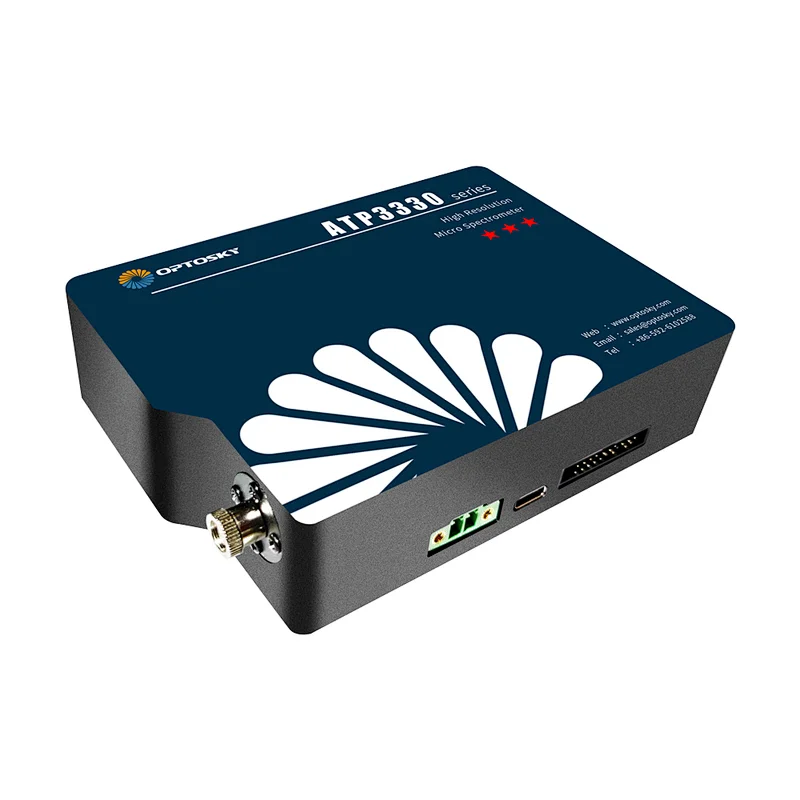
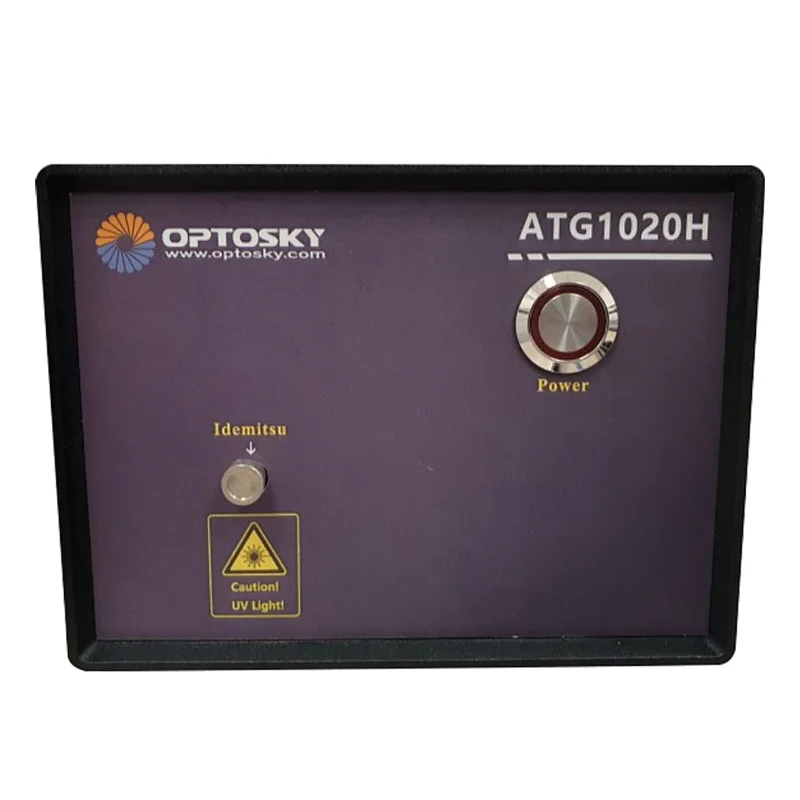
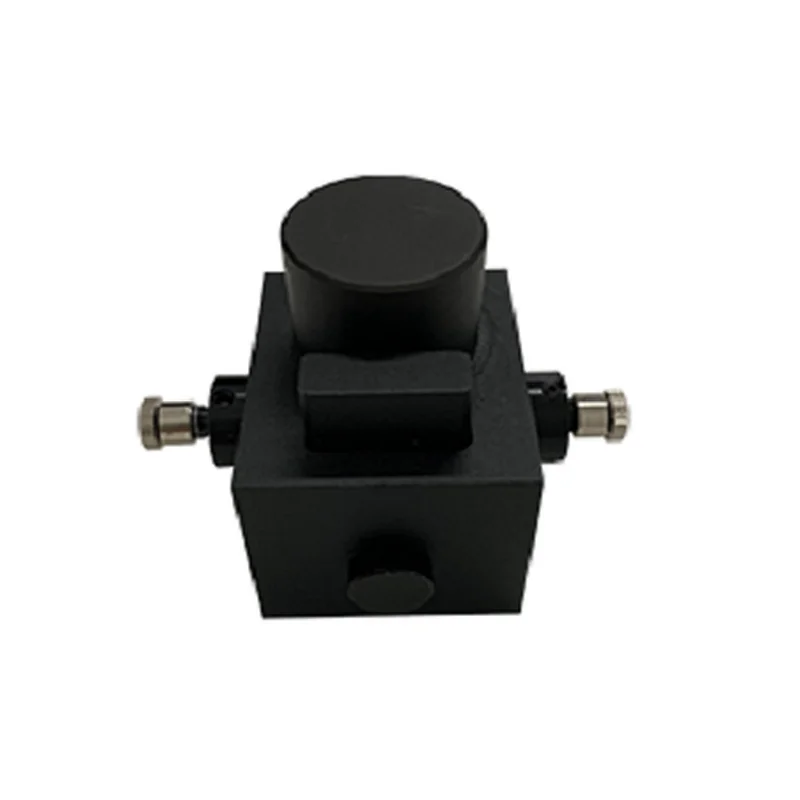
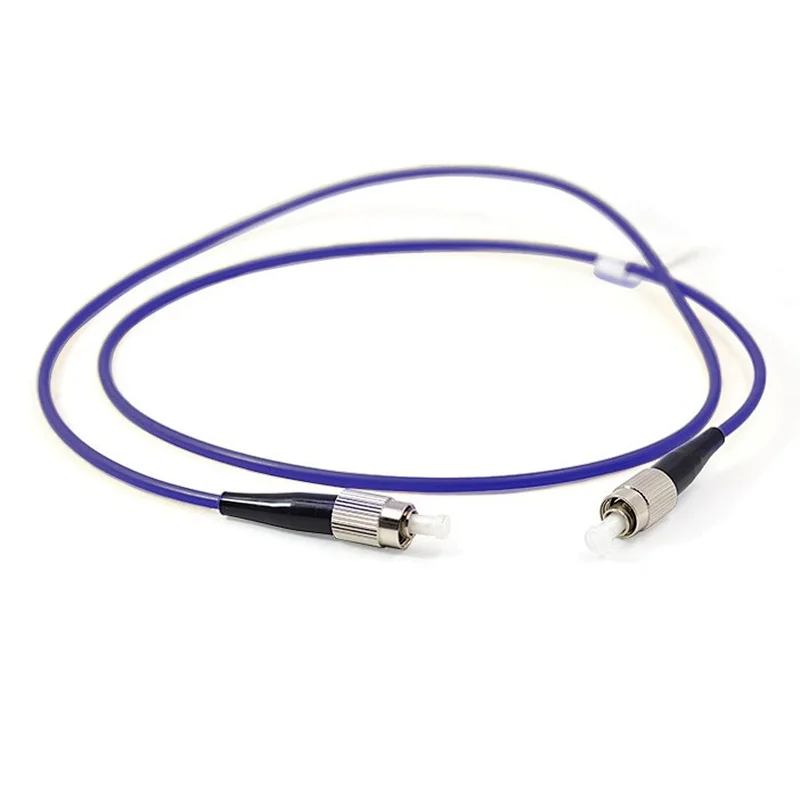
ATP3330 Deuterium Halogen Light Source ATG1020H Cuvette Holders ATP0080 UV-Visible Fibers
Related Blogs


ATP3330 Deuterium Halogen Light Source ATG1020H Cuvette Holders ATP0080 UV-Visible Fibers
Related Blogs
Estimation of Forage Biomass and Nutritional Value by Ground Spectrometer
How to Predict the Freshness of Peppers by Spectroscopy
Related Article

The ATP7810 is a wide-band, high-resolution infrared grating spectrometer covering up to 0.9–5 μm. Featuring a motorized rotating grating, multiple detector options (InGaAs/MCT), and flexible interfaces (SMA905 or free space, USB/UART control), it delivers high SNR and stability for absorption/reflection/transmission spectroscopy, laser wavelength testing, and fiber optic sensing.
New Product Recommendation | ATP7810 Ultra-Wide Range Infrared Spectrometer Series

This study uses the ATP5200P UV-Vis spectrometer to investigate xanthate adsorption on chalcopyrite surfaces. By analyzing absorbance at 300 nm under controlled pH and temperature, the method optimizes flotation conditions for copper recovery, enabling real-time, sensitive detection of adsorption mechanisms in non-ferrous mineral processing.
Using the ATP5200P Spectrometer to Unravel Xanthate Adsorption and Separation Mechanisms
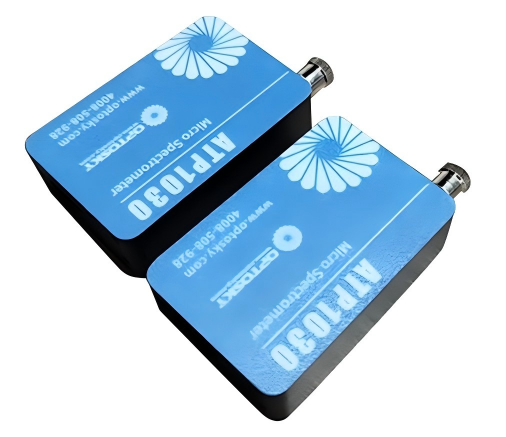
ATP1030 is an ultra‑compact, high‑resolution spectrometer covering 190–1100 nm. With a 1024‑pixel CMOS detector, adjustable integration time down to 1 ms, and USB‑powered design, it delivers reliable performance for applications like online water analysis, color measurement, handheld instruments, and Raman spectroscopy.
Product Recommendation | ATP1030 mini spectrometer Spectrometer

Vis-NIR transmission spectroscopy enables non-destructive identification of infertile duck eggs before incubation, achieving >95% accuracy. By detecting spectral fingerprints (e.g., 836 nm peak for fertile eggs), this method reduces energy waste and improves hatch rates, offering a low-cost, high-throughput solution for modern poultry farming.
Application case | How Spectral Technology is Transforming Duck Egg Farming